
如何使用“乳胶箭头符号”在图形中创建对角线箭头?
如何使用“乳胶箭头符号”在图形中创建对角线箭头?
提问于 2017-05-08 07:15:46
我想在一个从矩阵中读取的图形中显示特定细胞的方向。
在附图中,我可以创建左箭头,但我不知道如何在西南方向插入对角线箭头。
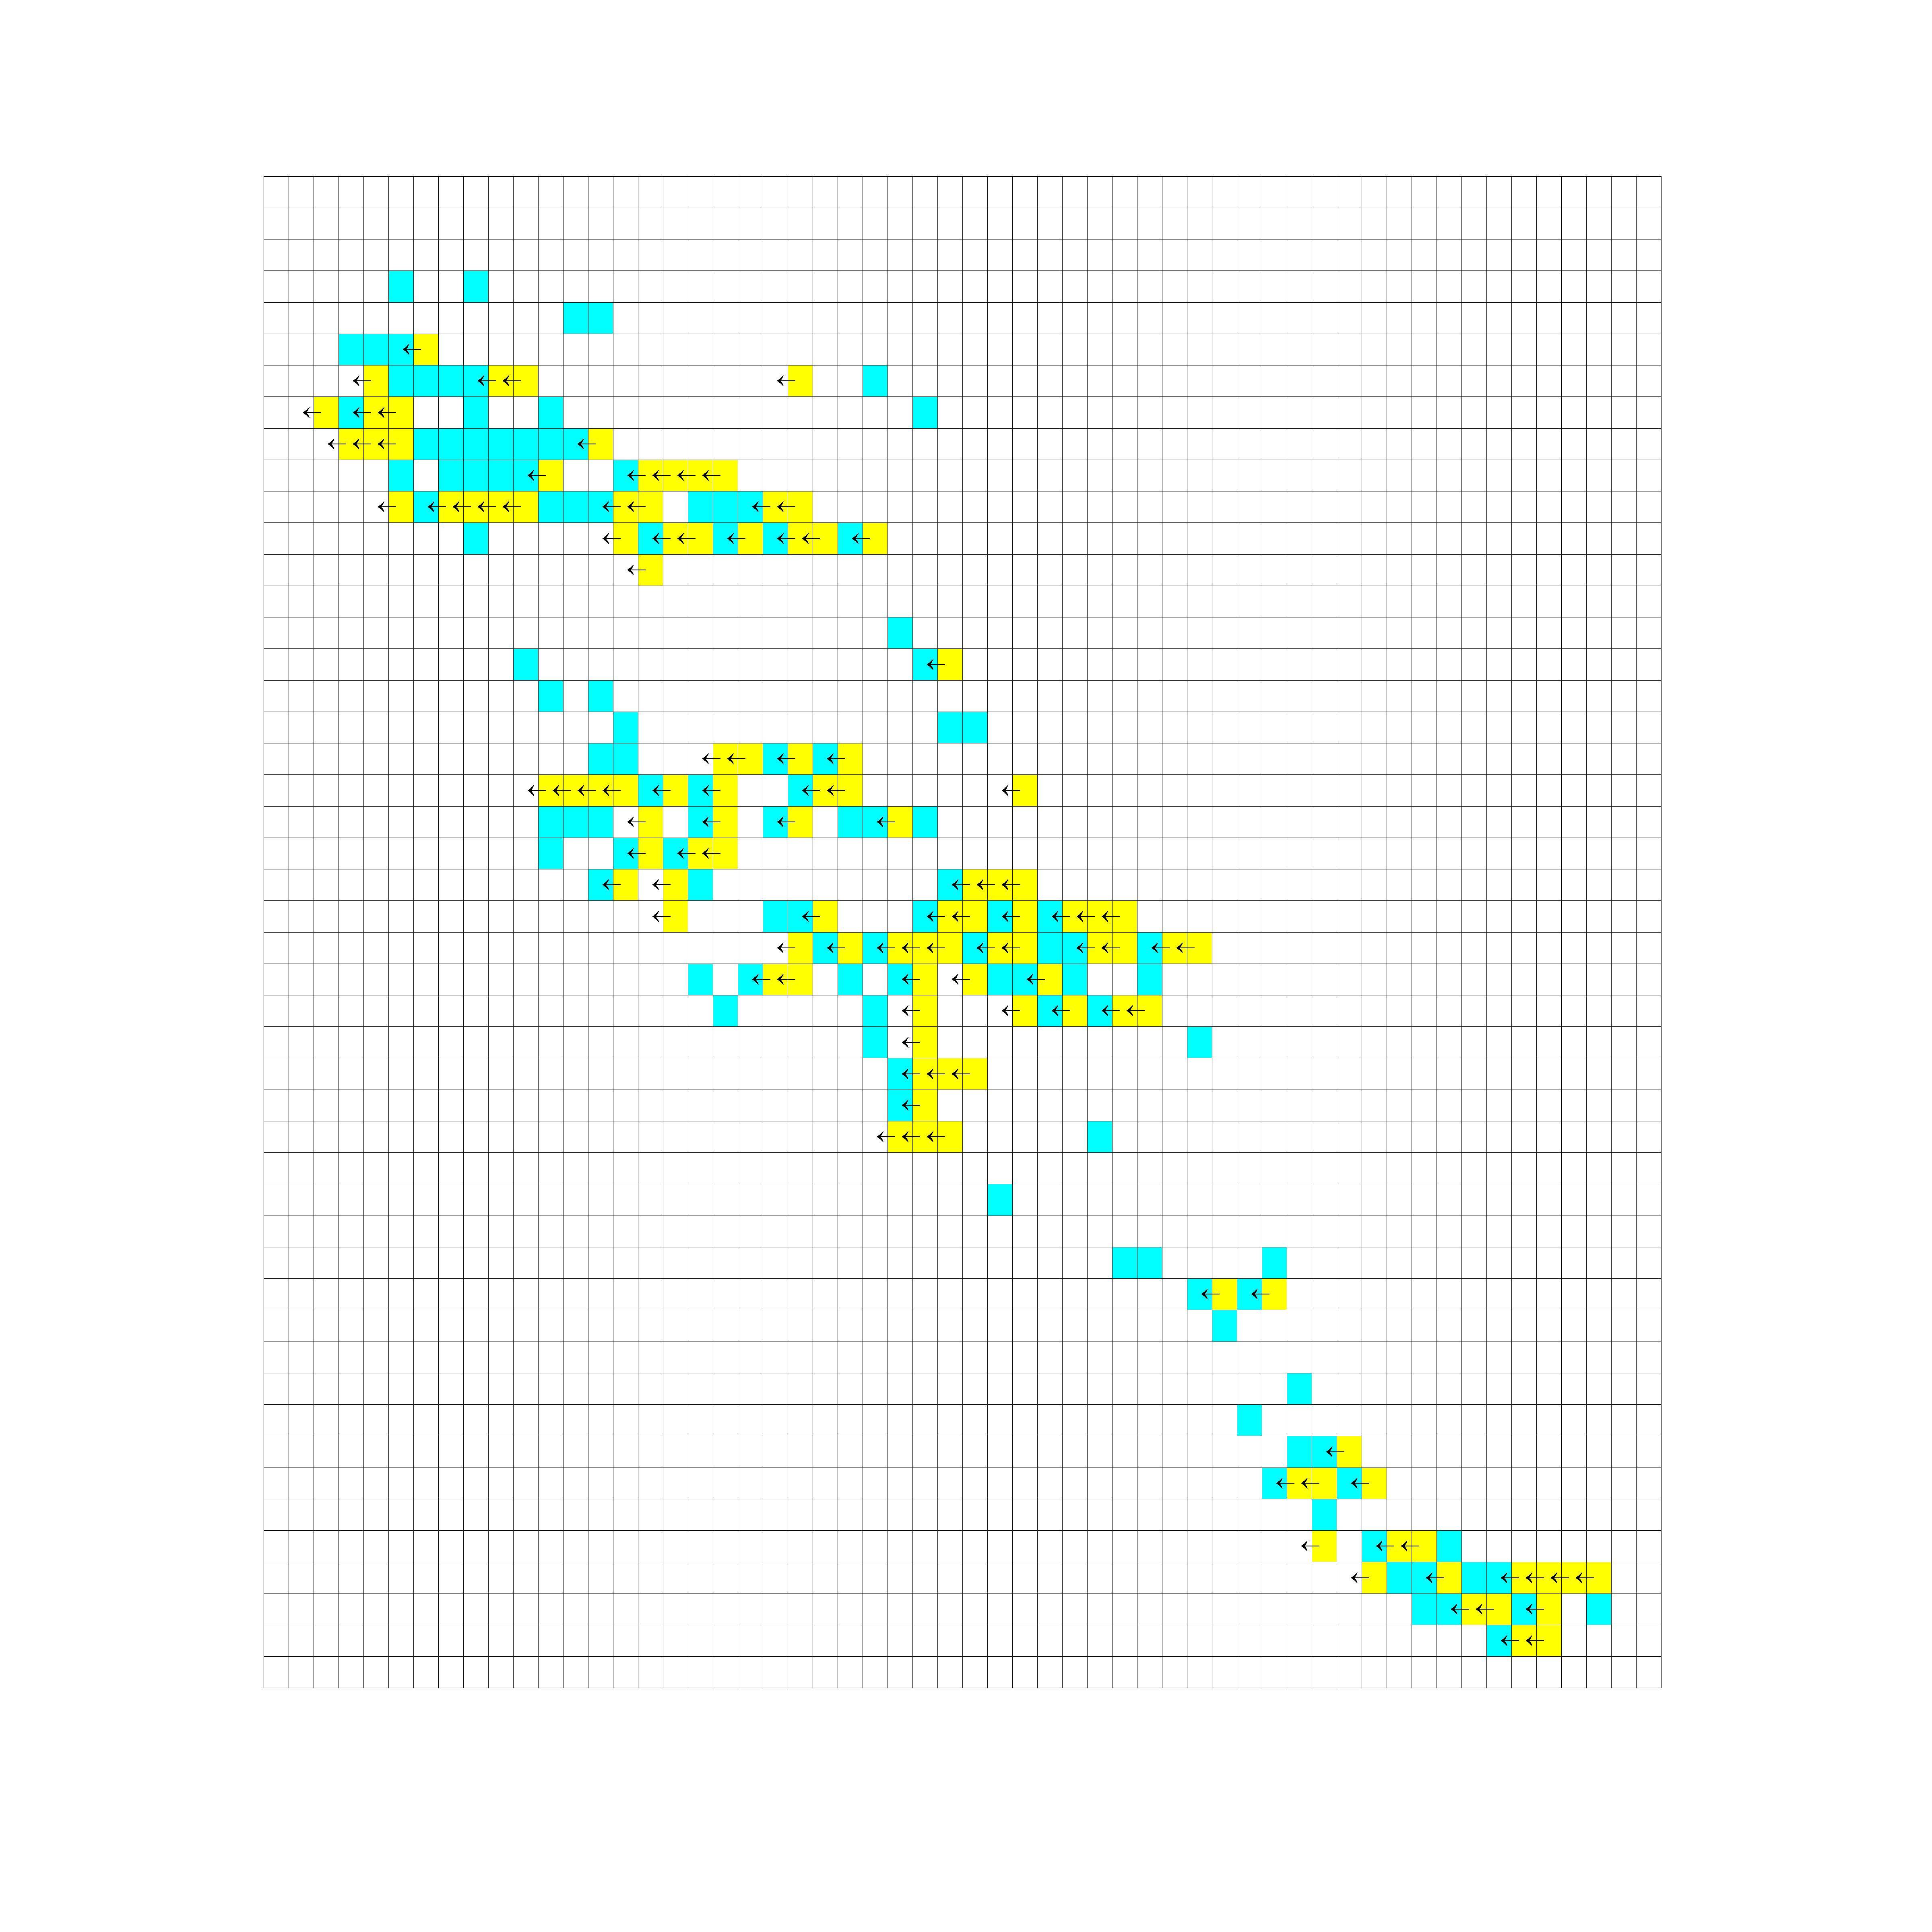
显然,乳胶箭头符号适用于左箭头、右箭头、上箭头和向下箭头,但对于对角线箭头则失败。
在附图中,我需要通过青色细胞在西南方向插入箭头。怎么做?
这是我正在尝试的剧本,
for row=1:size(data,1)
    for col=1:size(data,2);

        if data(row,col)==1
            rectangle('Position',[col-0.5 row 1 1], 'FaceColor','y','EdgeColor','k', 'LineWidth', 0.1)
            text(col-0.95,row+0.6,'\leftarrow', 'fontsize', 6);

        elseif data(row,col)==2
            rectangle('Position',[col-0.5 row 1 1], 'FaceColor','c','EdgeColor','k', 'LineWidth', 0.1)
            text(col-0.95,row+0.6,'\swarrow', 'fontsize', 6);

        else
            rectangle('Position',[col-0.5 row 1 1], 'FaceColor','w','EdgeColor','k', 'LineWidth', 0.1)
        end

    end

    set(gca,'Visible','off')
end
编辑: Annotation选项将增加复杂性,并需要为每一个其他问题定位箭头。如果一个人可以使用乳胶箭头符号,这个问题就会变得更加容易。
回答 1
Stack Overflow用户
回答已采纳
发布于 2017-05-18 19:55:23
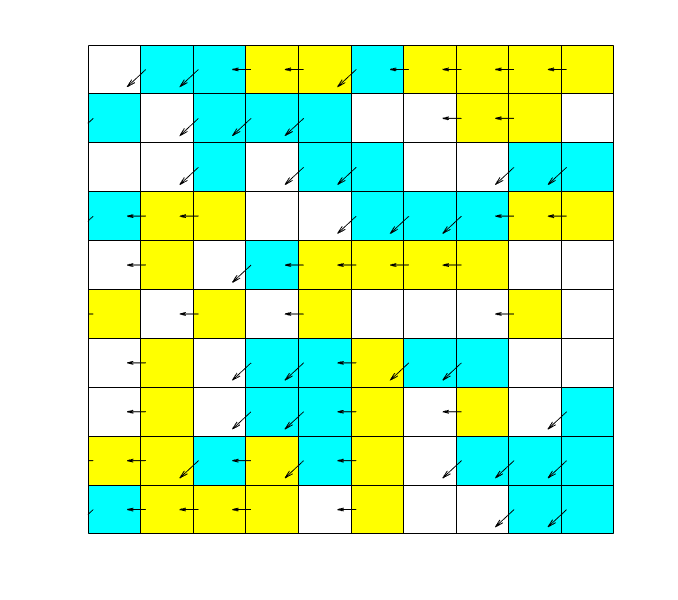
正如上面所建议的,您可以使用quiver绘制箭头。另外,pcolor是绘制所有矩形并对其着色的更好方法。
下面是一个代码示例,它使用这两种代码来创建您想要的东西:
data = randi(3,10)-1; % some random data
% plot the rectangles:
pcolor([data data(:,end);
        data(end,:) 0])
% set the colors to w-y-c:
colormap([1 1 1;
    1 1 0;
    0 1 1]);
[r, c] = ndgrid(1:size(data,1),1:size(data,2)); % a grid of all the cells
% logical indexing for the arrows:
leftarrow = (data==1);
swarrow = (data==2);
% plot all the arrows in black:
hold on
quiver([r r]+0.1,[c c]+0.5,[-leftarrow.' -swarrow.'],...
    [zeros(size(data)) -swarrow.'],'AutoScaleFactor',0.5,'Color','k')
hold off
set(gca,'Visible','off')
一个典型的结果是:
页面原文内容由Stack Overflow提供。腾讯云小微IT领域专用引擎提供翻译支持
原文链接:
https://stackoverflow.com/questions/43841840
复制相关文章
相似问题
腾讯云开发者

Copyright © 2013 - 2026 Tencent Cloud. All Rights Reserved. 腾讯云 版权所有
深圳市腾讯计算机系统有限公司 ICP备案/许可证号:粤B2-20090059 ![]() 粤公网安备44030502008569号
粤公网安备44030502008569号
腾讯云计算(北京)有限责任公司 京ICP证150476号 | 京ICP备11018762号