
可视化2个参数及其结果
可视化2个参数及其结果
提问于 2017-04-21 01:16:27
有两个参数我想要尝试不同的值:
a = [0.0, 0.5, 0.6]  # len == 3
b = [0.0, 0.02 , 0.05, 0.1]  # len == 4
对于a的每个值,尝试b的每个值。这与3*4=12个不同的结果一起出现。
我的数据格式为
res = [(0.0, 0.0, res1), (0.0, 0.02, res2), ...]有什么办法能让我清晰地想象这一切吗?我在考虑一个轮廓/热图或三维平面,但遗憾的是,我无法让它工作。
回答 1
Stack Overflow用户
回答已采纳
发布于 2017-04-21 07:48:56
有许多不同的选择。在任何情况下,第一步都需要将res列表转换为numpy数组。
对于许多绘图,如imshow、pcolor(mesh)或contourf,您需要有三个2D数组,您可以通过重塑输入数组来获得这些数组(考虑到它的排序是正确的)。
下面显示了您可以使用的一些选项:
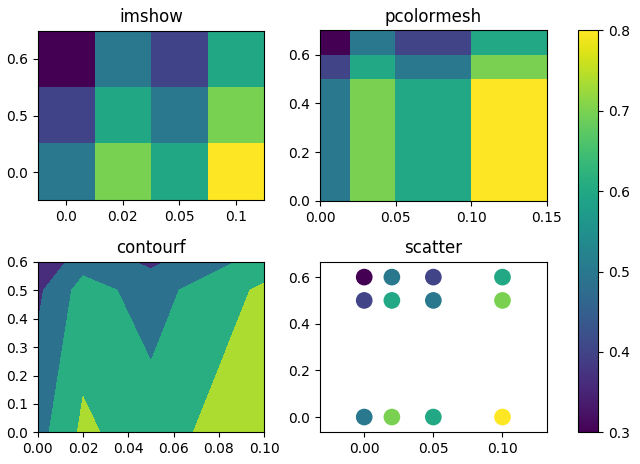
res = [(0.0, 0.0, 0.5), (0.0, 0.02, 0.7), (0.0, 0.05, 0.6), (0.0, 0.10, 0.8),
       (0.5, 0.0, 0.4), (0.5, 0.02, 0.6), (0.5, 0.05, 0.5), (0.5, 0.10, 0.7),
       (0.6, 0.0, 0.3), (0.6, 0.02, 0.5), (0.6, 0.05, 0.4), (0.6, 0.10, 0.6)]

import matplotlib.pyplot as plt
import numpy as np

res = np.array(res)
A = res[:,0].reshape(3,4) #A in y direction
B = res[:,1].reshape(3,4)
Z = res[:,2].reshape(3,4)

fig, ((ax, ax2), (ax3, ax4)) = plt.subplots(2,2)
#imshow
im = ax.imshow(Z, origin="lower")
ax.set_xticks(range(len(Z[0,:])))
ax.set_yticks(range(len(Z[:,0])))
ax.set_xticklabels(B[0,:])
ax.set_yticklabels(A[:,0])

#pcolormesh, first need to extend the grid
bp = np.append(B[0,:], [0.15])
ap = np.append(A[:,0], [0.7])
Bp, Ap = np.meshgrid(bp, ap)
ax2.pcolormesh(Bp, Ap, Z)

#contour
ax3.contourf(B, A, Z, levels=np.linspace(Z.min(), Z.max(),5))
#scatter
ax4.scatter(res[:,1], res[:,0], c=res[:,2], s=121)

ax.set_title("imshow")
ax2.set_title("pcolormesh")
ax3.set_title("contourf")
ax4.set_title("scatter")
plt.tight_layout()
fig.colorbar(im, ax=fig.axes, pad=0.05)
plt.show()页面原文内容由Stack Overflow提供。腾讯云小微IT领域专用引擎提供翻译支持
原文链接:
https://stackoverflow.com/questions/43532339
复制相关文章
相似问题
腾讯云开发者

Copyright © 2013 - 2026 Tencent Cloud. All Rights Reserved. 腾讯云 版权所有
深圳市腾讯计算机系统有限公司 ICP备案/许可证号:粤B2-20090059 ![]() 粤公网安备44030502008569号
粤公网安备44030502008569号
腾讯云计算(北京)有限责任公司 京ICP证150476号 | 京ICP备11018762号