
有什么好的彩色地图可以用python的PIL将灰度图像转换成彩色的吗?
有什么好的彩色地图可以用python的PIL将灰度图像转换成彩色的吗?
提问于 2017-04-17 18:31:06
Matplotlib有很多好的彩色地图,但是性能不好。我正在编写一些代码,以使灰度图像彩色,其中插入彩色地图是一个好主意。我想知道是否有开放源码的彩色地图可用或演示代码使用枕头将灰度图像转换成彩色图像通过彩色地图?
澄清:
- Matplotlib对演示使用很好,但是对于大量的图像来说性能却很差。
- Matplotlib共枕
- 你可以把灰度图像映射到彩色图片上。
演示:
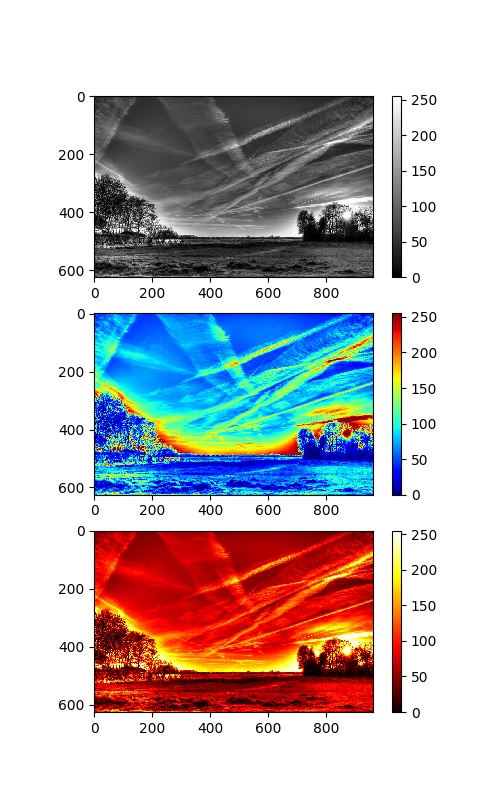
第一幅图像是灰度图,第二幅是“jet”图,第三幅是“热”图。
问题是我对颜色不太了解,我想在PIL中实现这样的效果,以获得更好的性能。
回答 2
Stack Overflow用户
回答已采纳
发布于 2017-04-23 04:46:29
我计算出@ImportanceOfBeingErnest (如何应用matplotlib彩色映射将Numpy数组转换为PIL图像)中提到的重复答案。
import matplotlib as mpl
import matplotlib.pyplot as plt
import matplotlib.image as mpimg
import numpy as np

import timeit

from PIL import Image

def pil_test():
    cm_hot = mpl.cm.get_cmap('hot')
    img_src = Image.open('test.jpg').convert('L')
    img_src.thumbnail((512,512))
    im = np.array(img_src)
    im = cm_hot(im)
    im = np.uint8(im * 255)
    im = Image.fromarray(im)
    im.save('test_hot.jpg')

def rgb2gray(rgb):
    return np.dot(rgb[:,:,:3], [0.299, 0.587, 0.114])

def plt_test():
    img_src = mpimg.imread('test.jpg')
    im = rgb2gray(img_src)
    f = plt.figure(figsize=(4, 4), dpi=128)
    plt.axis('off')
    plt.imshow(im, cmap='hot')
    plt.savefig('test2_hot.jpg', dpi=f.dpi)
    plt.close()

t = timeit.timeit(pil_test, number=30)
print('PIL: %s' % t)
t = timeit.timeit(plt_test, number=30)
print('PLT: %s' % t)
业绩的结果是:
PIL: 1.7473899199976586
PLT: 10.632971412000188他们都给了我类似的结果与hot彩色地图。

Stack Overflow用户
发布于 2017-12-18 10:38:32
您可以使用matplotlib中的颜色映射,并在不使用任何matplotlib图形的情况下应用它们。这将使事情变得更快:
import matplotlib.pyplot as plt

# Get the color map by name:
cm = plt.get_cmap('gist_rainbow')

# Apply the colormap like a function to any array:
colored_image = cm(image)

# Obtain a 4-channel image (R,G,B,A) in float [0, 1]
# But we want to convert to RGB in uint8 and save it:
Image.fromarray((colored_image[:, :, :3] * 255).astype(np.uint8)).save('test.png')
注意:
- 如果输入图像是浮动的,则值应该在间隔
[0.0, 1.0]中。 - 如果输入图像是整数,则整数应该在
[0, N)范围内,其中N是映射中的颜色数。但是您可以根据需要对任意数量的值进行重采样:如果您需要一个整数图像的8个彩色步骤,其值从0到7: cm =plt.get_cmap(‘gist_彩虹’,lut=8)
页面原文内容由Stack Overflow提供。腾讯云小微IT领域专用引擎提供翻译支持
原文链接:
https://stackoverflow.com/questions/43457308
复制相关文章
相似问题
腾讯云开发者

Copyright © 2013 - 2026 Tencent Cloud. All Rights Reserved. 腾讯云 版权所有
深圳市腾讯计算机系统有限公司 ICP备案/许可证号:粤B2-20090059 ![]() 粤公网安备44030502008569号
粤公网安备44030502008569号
腾讯云计算(北京)有限责任公司 京ICP证150476号 | 京ICP备11018762号