
用geom_raster()、geom_tile或geom_rect()绘制多层
我有一个b/w光栅图像数据的data.frame,我使用它作为背景/基本层。它有三列: x,y,z,其中x和y是各自的坐标,z是定义512 x 512图像的连续值。我将背景填充设置为黑白渐变,并使用geom_raster()在ggplot2中绘图,然后将图像保存到PDF文件中。
### MWE of base layer
# original 512x512 data is read in from a file in matrix format, so here's a mocked up example of same:
h = matrix(data = rep(c(1:512), 512), byrow = T, nrow = 512, ncol = 512)

# convert to data.frame with all the rows of z-data in first column
h = data.frame(z = as.vector(t(h)))

# create equally spaced 512x512 x and y pixel coordinate vectors
x = c(-255:256)
y = c(-255:256)

# add x and y coordinate vectors to the data.frame
h$x = rep(t(x), 512)
h$y = rep(t(-y), each=512)

# plot the data
ggplot() +
  coord_fixed() +
  geom_raster(data=h, aes(x,y,fill=z)) +
  scale_fill_gradient(low="black", high="white", na.value="transparent")

# save to png
ggsave("testbaseplot.png", dpi=300)
这在保存的文件中给出了所需的结果。

接下来,在该基本层的顶部,我绘制了一个或多个附加层。这些层还具有x、y和r。其中r是一个连续的或离散的值,取决于区域。例如,定义区域边界的层将标记离散区域,而在区域中定义拓扑的层将定义拓扑。
理想情况下,我希望两次使用geom_raster(),每层一次(基本,覆盖),在每一层上使用不同的aes(fill=),对每一层也使用不同的scale_fill_*()。但是,尝试这样做会导致错误:
# MWE of mock overlay = 4 square labeled regions
# create z-data for some example shapes
r = data.frame(r = as.vector(c(rep(rep(c('a','b'),each=100),100),
                               rep(rep(c('c','d'),each=100),100))))

# create x and y coordinates
r$x = rep(c(-99:100),200)
r$y = rep(c(-99:100),each=200)

# plot base layer and 1 overlay layer, both as geom_raster
ggplot() +
  coord_fixed() +
  geom_raster(data=h, aes(x,y,fill=z)) +
  scale_fill_gradient(low="black", high="white", na.value="transparent") +
  geom_raster(data=r, aes(x,y,fill=r)) +
  scale_fill_manual(values=c("red","white","blue","yellow"))
错误信息:
“填充”的比例已经存在。为“填充”添加另一个刻度,这将取代现有的刻度。错误:连续值提供给离散尺度
我想也许我可以用aes(fill=z)做一个aes(fill=z),用aes(colour=r)和scale_colour_manual做一个,但是geom_raster()不承认aes(colour=)选项,所以我使用了geom_tile(aes(colour=r)):
# plot looks fine
ggplot() +
  coord_fixed() +
  geom_raster(data=h, aes(x,y,fill=z)) +
  scale_fill_gradient(low="black", high="white", na.value="transparent") +
  geom_tile(data=r, aes(x,y,colour=r), fill="transparent") +
  scale_colour_manual(values=c("red","white","blue","yellow"))

# saved file does not
ggsave("testlayerplot.png", dpi=300)
在RStudio的预览窗口中,情节看起来很好,但是当保存为文件(pdf、png等)时,瓷砖层上有一个不想要的行的网格。
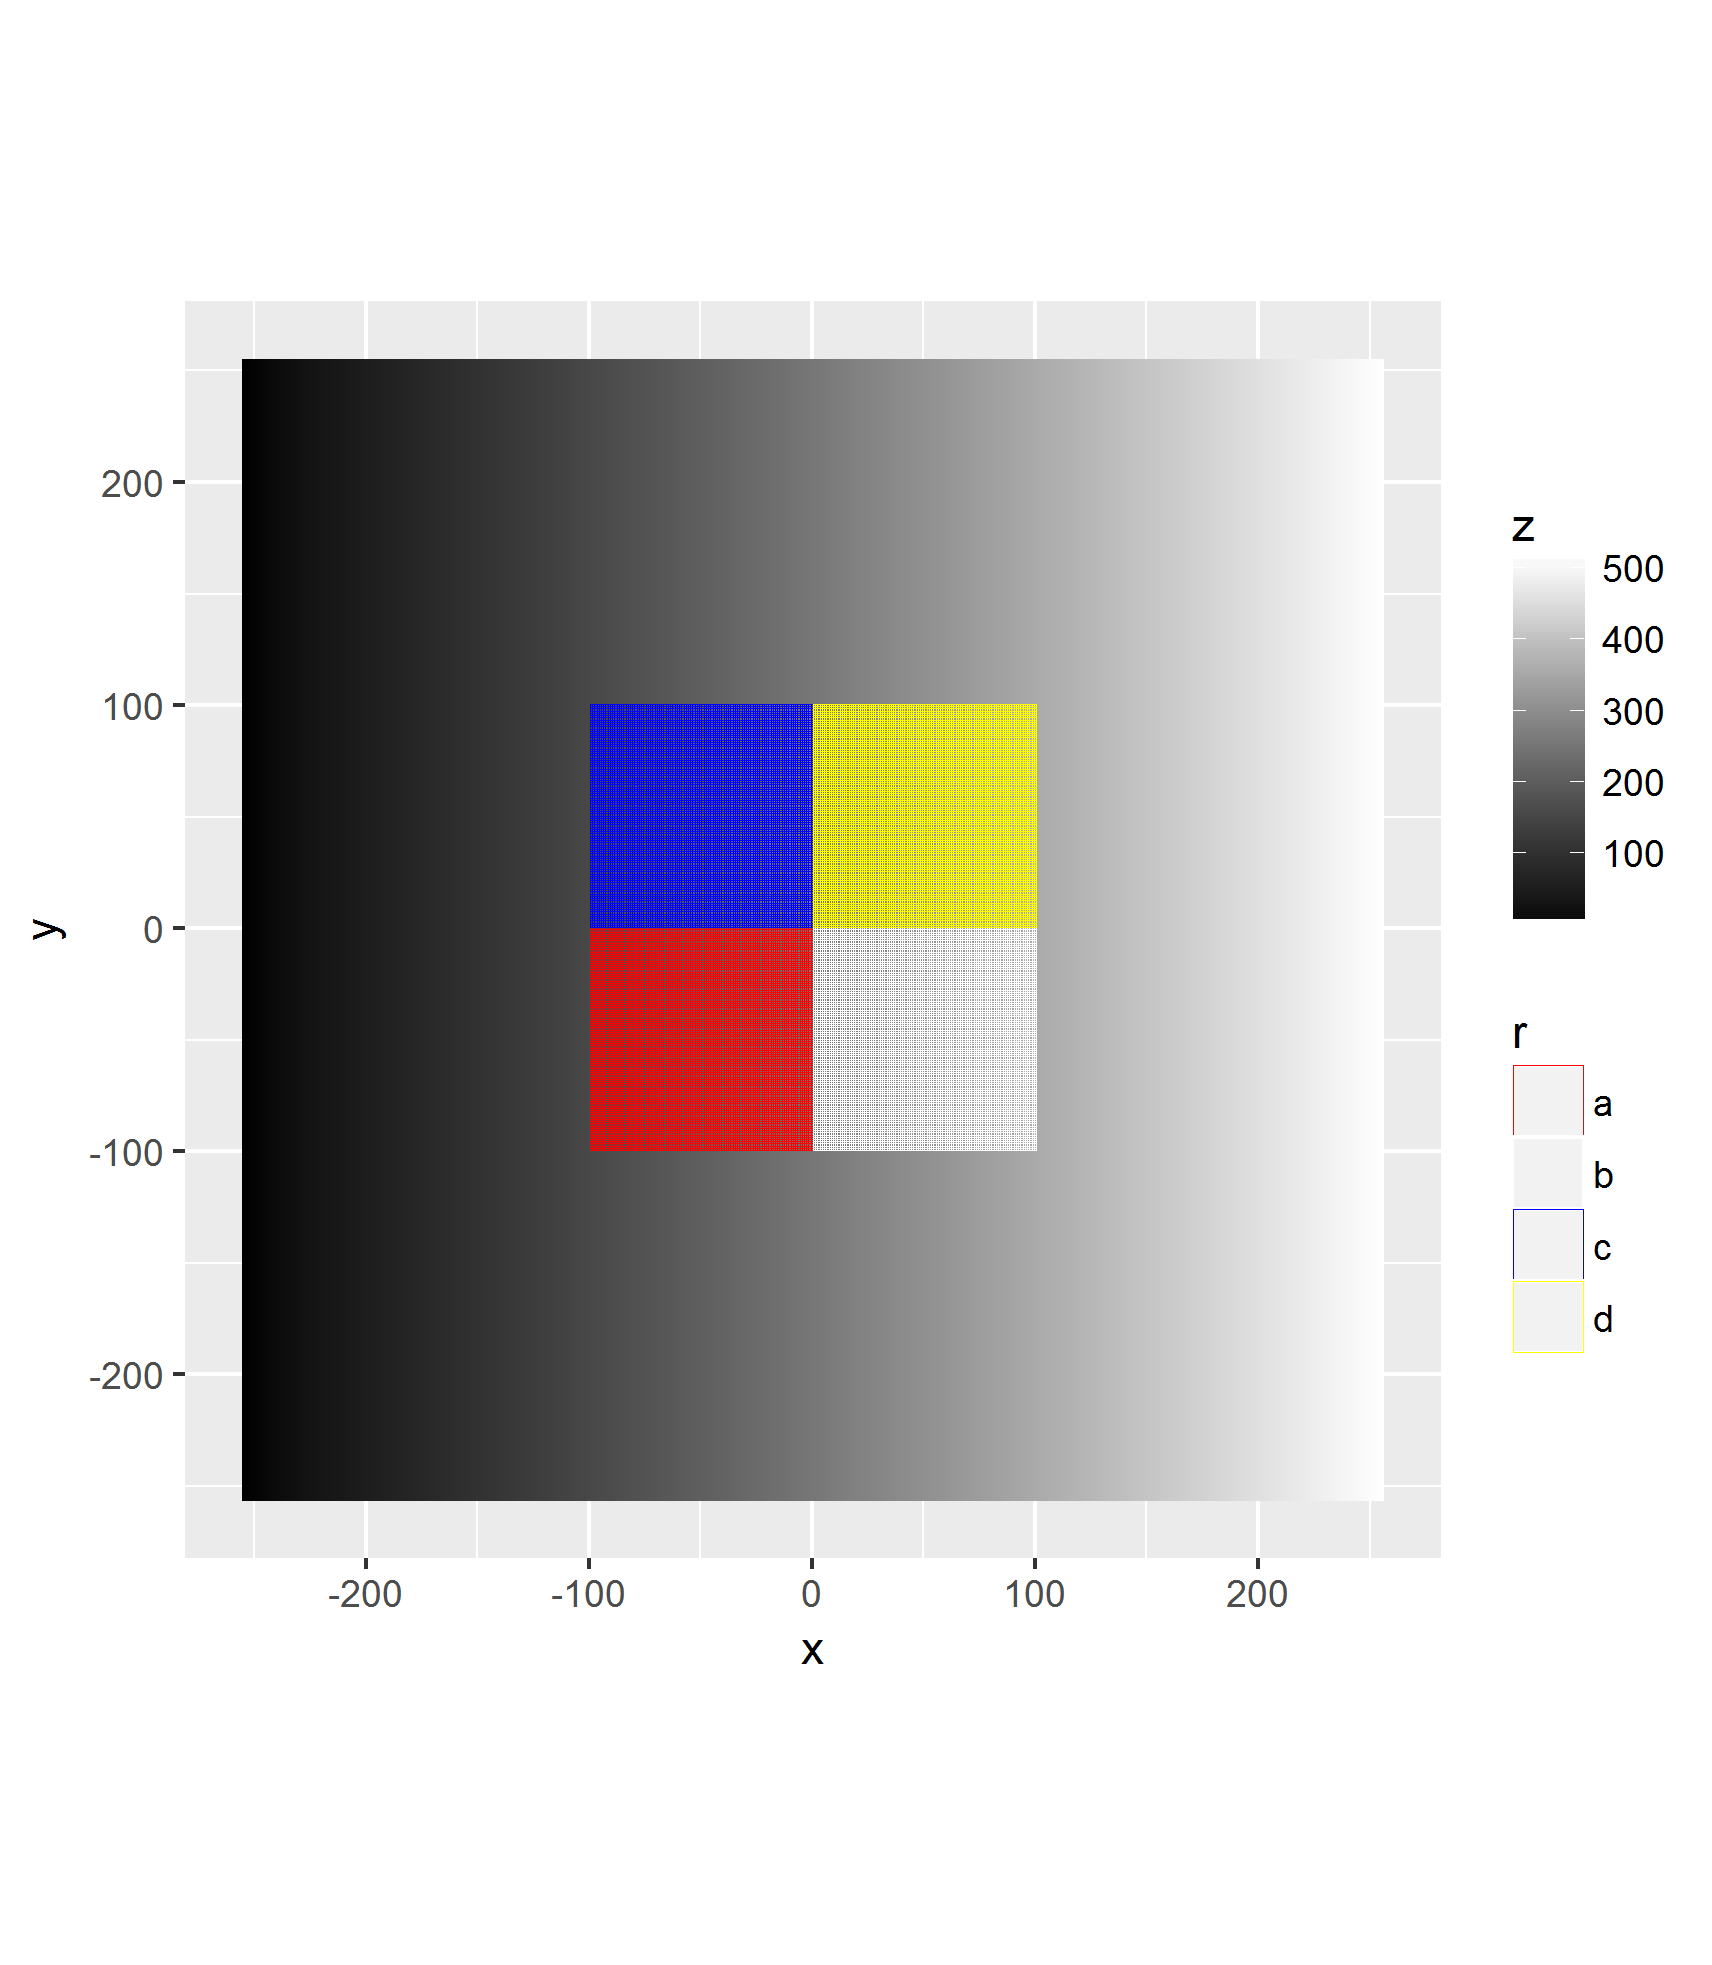
我相信这些行的出现是因为geom_tile的默认填充是灰色的。这是文件格式造成的吗?由于默认的灰色填充geom_tile忽略了fill="transparent"选项?其他原因?
我觉得我走错路了。我可能会把矩阵格式的原始栅格数据转换成x,y,z data.frame格式。因为我更了解data.frame格式。
第一部分:,我可以用ggplot在另一个光栅上画出不需要的线条吗?如果是这样的话,是怎么做的?我还可以在覆盖层中添加一个alpha=.5透明度吗?
第二部分:是否有一种方法可以绘制原始光栅矩阵格式,而不必先转换为x、y、z data.frame格式?如果是这样的话,是怎么做的?我可以在覆盖层上设置透明度吗?
回答 1
Stack Overflow用户
发布于 2017-04-13 14:57:06
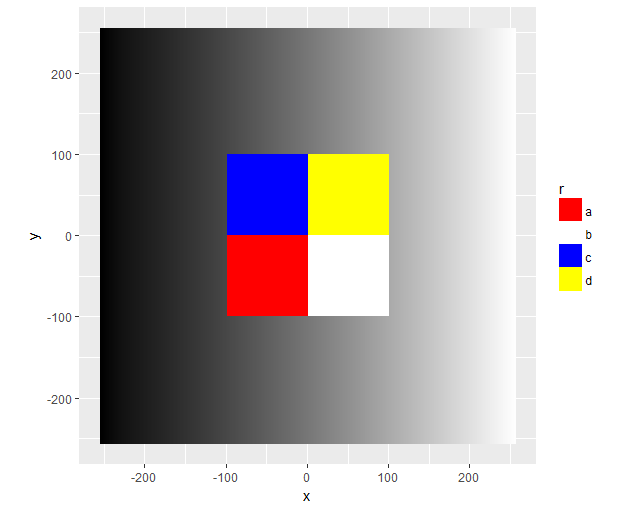
只需做一点点工作,您就可以使用annotate创建背景,而无需映射,因此中心仍然可以使用填充比例尺:
h$z <- (h$z - min(h$z)) / diff(range(h$z))
ggplot() +
  coord_fixed() +
  annotate(
    geom = 'raster',
    x = h$x,
    y = h$y,
    fill = scales::colour_ramp(c("black", "white"))(h$z)
  ) +
  geom_raster(aes(x, y, fill = r), data = r) +
  scale_fill_manual(values=c("red", "white", "blue", "yellow"))
https://stackoverflow.com/questions/43395219
复制相似问题
腾讯云开发者

Copyright © 2013 - 2026 Tencent Cloud. All Rights Reserved. 腾讯云 版权所有
深圳市腾讯计算机系统有限公司 ICP备案/许可证号:粤B2-20090059 ![]() 粤公网安备44030502008569号
粤公网安备44030502008569号
腾讯云计算(北京)有限责任公司 京ICP证150476号 | 京ICP备11018762号