
如何用python绘制试验的结果?
如何用python绘制试验的结果?
提问于 2017-04-13 03:39:54
我计算了12个数据集和11个分类器的Friedman测试结果,我想绘制如下的结果
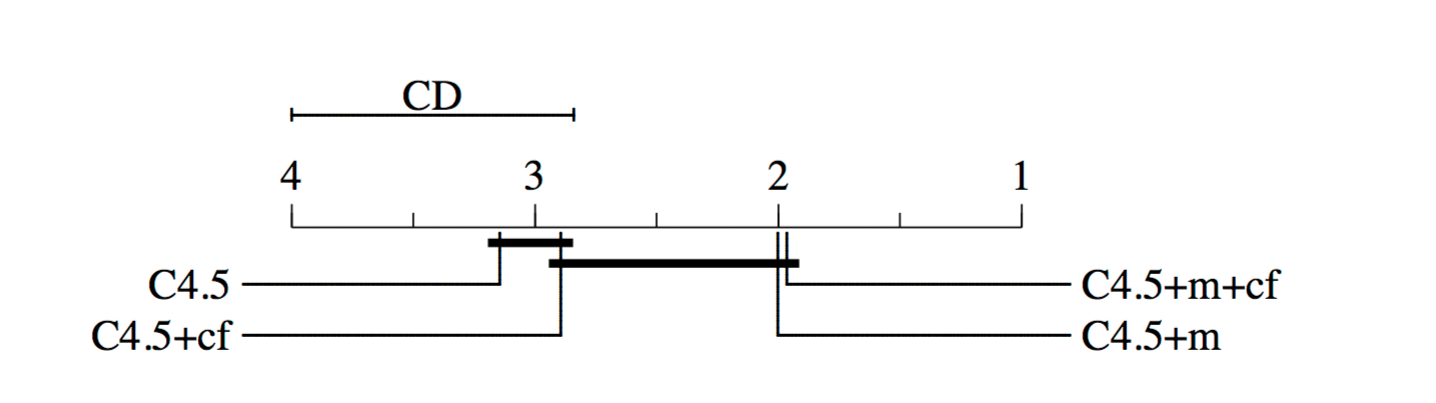
我计算了所有的要求CD是单数(如图中所示)、分类器列表(C4.5+m+cf、C4.5+m和so)以及平均排序值(在x轴上)。
事先非常感谢
2:在这里输入链接描述
回答 1
Stack Overflow用户
发布于 2018-12-15 19:15:12
import Orange
import matplotlib.pyplot as plt
names = ["first", "third", "second", "fourth" ]
avranks =  [1.9, 3.2, 2.8, 3.3 ]
cd = Orange.evaluation.compute_CD(avranks, 30) #tested on 30 datasets
Orange.evaluation.graph_ranks(avranks, names, cd=cd, width=6, textspace=1.5)
plt.show()页面原文内容由Stack Overflow提供。腾讯云小微IT领域专用引擎提供翻译支持
原文链接:
https://stackoverflow.com/questions/43383144
复制相关文章
相似问题
腾讯云开发者

Copyright © 2013 - 2026 Tencent Cloud. All Rights Reserved. 腾讯云 版权所有
深圳市腾讯计算机系统有限公司 ICP备案/许可证号:粤B2-20090059 ![]() 粤公网安备44030502008569号
粤公网安备44030502008569号
腾讯云计算(北京)有限责任公司 京ICP证150476号 | 京ICP备11018762号