
Python PieChart (它可以做CallOut标签吗)
Python PieChart (它可以做CallOut标签吗)
提问于 2017-04-11 14:35:24
有没有用Python、Matplotlib等做CallOut标签的例子?
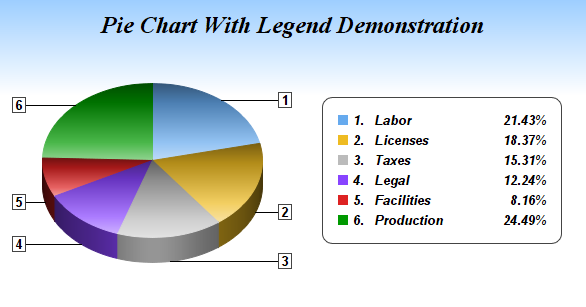
图像源
上面有一条线和标签指向饼图外的东西。无法看到使用Mathplotlib进行此操作的任何可能示例..。这能用Python完成吗??
回答 1
Stack Overflow用户
回答已采纳
发布于 2017-04-11 15:03:23
您可以使用matplotlib 注解创建文本标签和注释行。
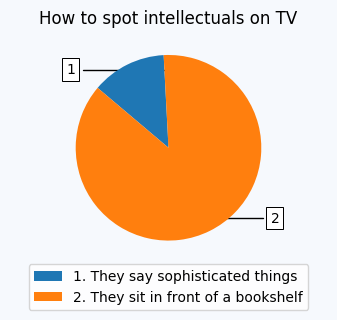
人工标记
下面是一个示例,在数据坐标中手动定位标签,即饼图的中心是(0,0)坐标。
import matplotlib.pyplot as plt

fig, ax= plt.subplots(figsize=(4,4))
plt.subplots_adjust(bottom=0.3)
total = [13,87]
plt.title('How to spot intellectuals on TV')
plt.gca().axis("equal")
pie = plt.pie(total, startangle=93)
labels = ["1. They say sophisticated things", "2. They sit in front of a bookshelf"]

bbox_props = dict(boxstyle="square,pad=0.3", fc="w", ec="k", lw=0.72)
arrowprops=dict(arrowstyle="-",connectionstyle="angle,angleA=0,angleB=90")
kw = dict(xycoords='data',textcoords='data',
          arrowprops=arrowprops, bbox=bbox_props, zorder=0)
plt.gca().annotate("2", xy=(0, 0), xytext=( 1.1, -0.8), **kw )
plt.gca().annotate("1", xy=(0, 0), xytext=(-1.1,  0.8), **kw )

plt.legend(pie[0],labels, loc="center", bbox_to_anchor=(0.5,-0.1))
plt.show()
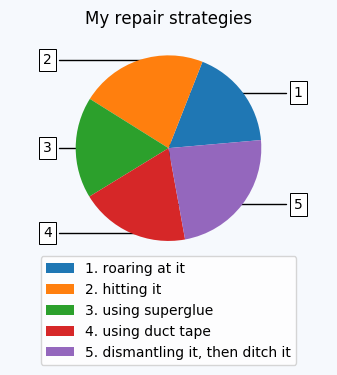
自动标签:
我们可以利用楔形的角度在位置自动创建标签,这是合适的。
import matplotlib.pyplot as plt
import numpy as np

fig, ax= plt.subplots(figsize=(4,4))
plt.subplots_adjust(bottom=0.3)
total = [12,15,12,13,16]
plt.title('My repair strategies')
plt.gca().axis("equal")
patches, texts = pie = plt.pie(total, startangle=5)
labels = ["1. roaring at it",
          "2. hitting it",
          "3. using superglue",
          "4. using duct tape",
          "5. dismantling it, then ditch it"]

bbox_props = dict(boxstyle="square,pad=0.3", fc="w", ec="k", lw=0.72)
arrowprops=dict(arrowstyle="-",connectionstyle="angle,angleA=0,angleB=90")
kw = dict(xycoords='data',textcoords='data',arrowprops=arrowprops,
          bbox=bbox_props, zorder=0, va="center")

for i, p in enumerate(patches):
    ang = (p.theta2 - p.theta1)/2.+p.theta1
    y = np.sin(ang/180.*np.pi)
    x = 1.35*np.sign(np.cos(ang/180.*np.pi))
    plt.gca().annotate(str(1+i), xy=(0, 0), xytext=( x, y), **kw )

plt.legend(pie[0],labels, loc="center", bbox_to_anchor=(0.5,-0.2))
plt.show()
页面原文内容由Stack Overflow提供。腾讯云小微IT领域专用引擎提供翻译支持
原文链接:
https://stackoverflow.com/questions/43349004
复制相关文章
相似问题
腾讯云开发者

Copyright © 2013 - 2026 Tencent Cloud. All Rights Reserved. 腾讯云 版权所有
深圳市腾讯计算机系统有限公司 ICP备案/许可证号:粤B2-20090059 ![]() 粤公网安备44030502008569号
粤公网安备44030502008569号
腾讯云计算(北京)有限责任公司 京ICP证150476号 | 京ICP备11018762号