
Matlab -用已知参数正态分布的均值未知的正态分布
Matlab -用已知参数正态分布的均值未知的正态分布
提问于 2017-04-06 14:17:32
当单变量正态分布具有未知的均值时,如何用Matlab绘制出它的正态分布,但均值也是正态分布的,均值的均值和方差是已知的?
例如:N(平均,4)和平均~N(2,8)
回答 1
Stack Overflow用户
回答已采纳
发布于 2017-04-08 15:47:14
使用总概率定律,您可以编写
pdf(x) = int(pdf(x | mean) * pdf(mean) dmean)因此,我们可以在Matlab中进行如下计算:
% define the constants
sigma_x = 4;
mu_mu = 2;
sigma_mu = 8;

% define the pdf of a normal distribution using the Symbolic Toolbox
% to be able to calculate the integral
syms x mu sigma
pdf(x, mu, sigma) = 1./sqrt(2*pi*sigma.^2) * exp(-(x-mu).^2/(2*sigma.^2));

% calculate the desired pdf
pdf_x(x) = int(pdf(x, mu, sigma_x) * pdf(mu, mu_mu, sigma_mu), mu, -Inf, Inf);
pdfCheck = int(pdf_x, x, -Inf, Inf) % should be one

% plot the desired pdf (green) and N(2, 4) as reference (red)
xs = -40:0.1:40;
figure
plot(xs, pdf(xs, mu_mu, sigma_x), 'r')
hold on
plot(xs, pdf_x(xs), 'g')
请注意,我还检查了计算的pdf的积分确实等于1,这是成为pdf的必要条件。
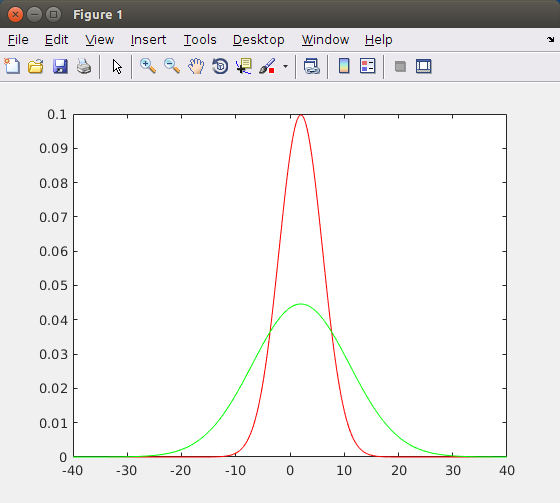
绿色的地块是要求的pdf。红图被添加为参考,并表示为一个恒定的平均值(等于平均)的pdf。
页面原文内容由Stack Overflow提供。腾讯云小微IT领域专用引擎提供翻译支持
原文链接:
https://stackoverflow.com/questions/43257848
复制相关文章
相似问题
腾讯云开发者

Copyright © 2013 - 2026 Tencent Cloud. All Rights Reserved. 腾讯云 版权所有
深圳市腾讯计算机系统有限公司 ICP备案/许可证号:粤B2-20090059 ![]() 粤公网安备44030502008569号
粤公网安备44030502008569号
腾讯云计算(北京)有限责任公司 京ICP证150476号 | 京ICP备11018762号