
时间序列数据的峰值到低谷
时间序列数据的峰值到低谷
提问于 2017-03-31 19:05:34
寻找一个股票指数的时间序列下降了10%或更大的每一个例子。我正在努力编写它的程序,以便它理解秩序的重要性(不希望升值10%)。
理想情况下,代码会:选择值,在值低于10%之后检查值,如果没有,检查下一步,继续检查,直到找到一个,然后记录下来。然后,移到“低谷”或“谷地”作为开始,在它比该值低10%或更多之后,继续检查它的值。
# Import Libraries
import pandas as pd
import numpy as np
import peakutils
from peakutils.plot import plot as pplot
from matplotlib import pyplot
import matplotlib.pyplot as plt
from scipy import signal
import csv
import scipy
import plotly.plotly as py
import plotly.graph_objs as go
from plotly.tools import FigureFactory as FF

# from pandas import DataFrame

# Import Excel as array
index = pd.read_csv(r"\Users\Reed_2\Desktop\Indexonly.csv")
print("as Pandas")
print (index.values)
# convert to 2 NumPy arrays
dates = index['Date'].as_matrix()
values = index['Index'].as_matrix()
print("values as NumPy")
print(values)
print("Date values")
print(dates)

# Find peaks
peaks = peakutils.indexes(values, thres=0.1, min_dist=1)

print ("peaks")
print(peaks)

a = np.asarray(peaks)
np.savetxt(r"C:\Users\Reed_2\Desktop\export.csv", a, delimiter=",")
可以访问Python、R Studio和MatLab。我最喜欢Python。
非常感谢你在这方面的帮助。
回答 1
Stack Overflow用户
发布于 2017-03-31 19:31:25
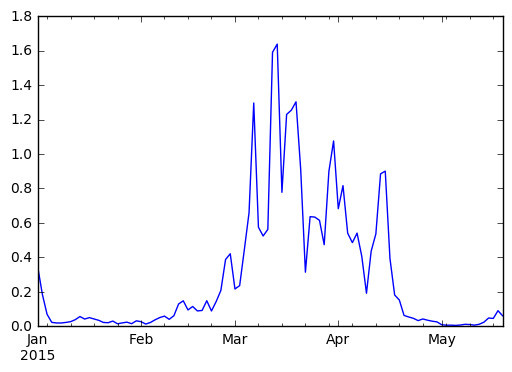
考虑一下返回的系列s
np.random.seed([3,1415])
s = pd.Series(
    np.random.lognormal(.005, .5, size=100),
    pd.date_range('2015-01-01', periods=100, freq='B')
).cumprod()

s.plot()
使用生成器将索引切片
def gen_slice(s, thresh):
    sidx = s.index
    idx = s.index[0]
    v = s.get_value(idx)
    yield idx
    for idx in sidx[1:]:
        v0 = s.get_value(idx)
        if (v0 / v) < 1-thresh:
            v = v0
            yield idx


s.loc[list(gen_slice(s, .1))]

2015-01-01    0.346504
2015-01-02    0.184687
2015-01-05    0.069298
2015-01-06    0.022508
2015-01-07    0.018996
2015-01-26    0.014204
2015-02-03    0.012777
2015-05-01    0.008999
2015-05-04    0.006039
2015-05-06    0.004855
dtype: float64
我们可以看到,每一个百分比的变化都小于10%。
s.loc[list(gen_slice(s, .1))].pct_change()

2015-01-01         NaN
2015-01-02   -0.467000
2015-01-05   -0.624783
2015-01-06   -0.675194
2015-01-07   -0.156034
2015-01-26   -0.252278
2015-02-03   -0.100442
2015-05-01   -0.295665
2015-05-04   -0.328967
2015-05-06   -0.195990
dtype: float64
我们可以画出这些事件发生的地点。
idx = list(gen_slice(s, .1))

ax = s.plot()
ax.vlines(idx, s.min(), s.max())

另见下文:
可能有必要遍历一个系列的元素或数据帧的行,其方式是下一个元素或下一个行依赖于先前选定的元素或行。这称为路径依赖关系。
考虑以下不规则频率的时间序列s。
#starting python community conventions
import numpy    as np
import pandas   as pd

# n is number of observations
n = 5000

day = pd.to_datetime(['2013-02-06'])
# irregular seconds spanning 28800 seconds (8 hours)
seconds = np.random.rand(n) * 28800 * pd.Timedelta(1, 's')
# start at 8 am
start = pd.offsets.Hour(8)
# irregular timeseries
tidx = day + start + seconds
tidx = tidx.sort_values()

s = pd.Series(np.random.randn(n), tidx, name='A').cumsum()
s.plot();
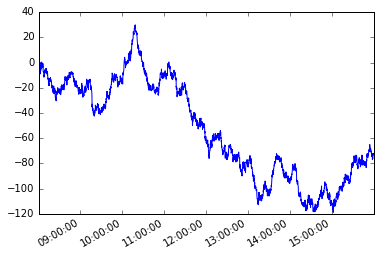
让我们假设路径依赖条件。从该系列的第一个成员开始,我希望获取每个后续元素,以便该元素与当前元素之间的绝对差异大于或等于x。
我们将使用python生成器解决这个问题。
生成器函数
def mover(s, move_size=10):
    """Given a reference, find next value with
    an absolute difference >= move_size"""
    ref = None
    for i, v in s.iteritems():
        if ref is None or (abs(ref - v) >= move_size):
            yield i, v
ref = v然后我们就可以定义一个新的系列moves,如下所示
moves = pd.Series({i:v for i, v in mover(s, move_size=10)},
                  name='_{}_'.format(s.name))
把他们都画出来
moves.plot(legend=True)
s.plot(legend=True)
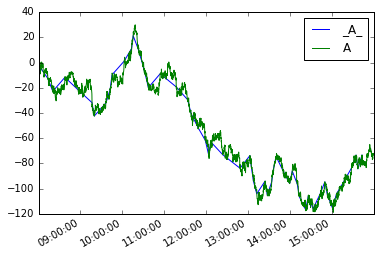
数据文件的模拟将是:
def mover_df(df, col, move_size=2):
    ref = None
    for i, row in df.iterrows():
        if ref is None or (abs(ref - row.loc[col]) >= move_size):
            yield row
            ref = row.loc[col]

df = s.to_frame()
moves_df = pd.concat(mover_df(df, 'A', 10), axis=1).T

moves_df.A.plot(label='_A_', legend=True)
df.A.plot(legend=True)

页面原文内容由Stack Overflow提供。腾讯云小微IT领域专用引擎提供翻译支持
原文链接:
https://stackoverflow.com/questions/43147940
复制相关文章
相似问题
腾讯云开发者

Copyright © 2013 - 2026 Tencent Cloud. All Rights Reserved. 腾讯云 版权所有
深圳市腾讯计算机系统有限公司 ICP备案/许可证号:粤B2-20090059 ![]() 粤公网安备44030502008569号
粤公网安备44030502008569号
腾讯云计算(北京)有限责任公司 京ICP证150476号 | 京ICP备11018762号