
向Plots.jl子图添加全局标题
向Plots.jl子图添加全局标题
提问于 2017-03-28 10:21:31
我想使用Plots.jl向一组子图添加一个全局标题。
理想情况下,我会做这样的事情:
using Plots
pyplot()
plot(rand(10,2), plot_title="Main title", title=["A" "B"], layout=2)但是,根据Plots.jl文档,plot_title属性尚未实现:
整个地块的标题(不是子图)(注:目前未执行)
与此同时,有什么办法可以绕过它吗?
我目前正在使用pyplot后端,但我并没有特别地绑定到它。
回答 3
Stack Overflow用户
发布于 2019-10-18 13:05:12
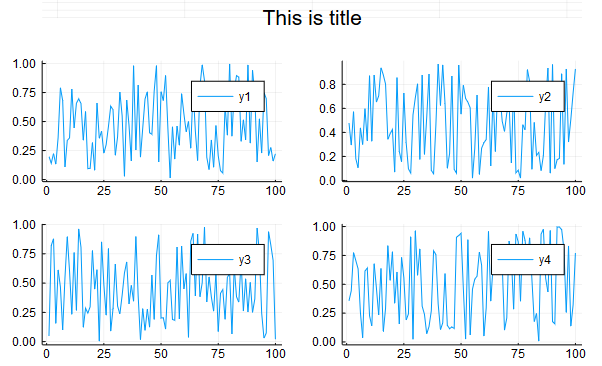
这是一个有点黑客,但应该是不可知论的后端。基本上创建一个新的地块,其中唯一的内容是您想要的标题,然后使用layout将其添加到顶部。下面是一个使用GR后端的示例:
# create a transparent scatter plot with an 'annotation' that will become title
y = ones(3)
title = Plots.scatter(y, marker=0,markeralpha=0, annotations=(2, y[2], Plots.text("This is title")),axis=false, grid=false, leg=false,size=(200,100))

# combine the 'title' plot with your real plots
Plots.plot(
    title,
    Plots.plot(rand(100,4), layout = 4),
    layout=grid(2,1,heights=[0.1,0.9])
)
生产:
Stack Overflow用户
发布于 2021-10-25 19:21:14
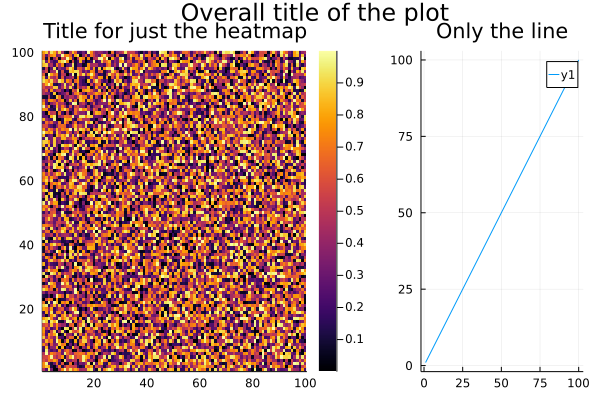
最近版本的Plots.jl支持plot_title属性,该属性为整个绘图提供了一个标题。这可以与个别情节的个别标题相结合。
using Plots

layout = @layout [a{0.66w} b{0.33w}]
LHS = heatmap(rand(100, 100), title="Title for just the heatmap")
RHS = plot(1:100, 1:100, title="Only the line")
plot(LHS, RHS, plot_title="Overall title of the plot")
或者,您可以直接设置现有地块的标题。
p = plot(LHS, RHS)
p[:plot_title] = "Overall title of the plot"
plot(p)
Stack Overflow用户
发布于 2017-03-29 07:22:51
subplots是Plot类型的字段,每个子图都有一个名为:attr的字段,您可以修改该字段并重新生成该图。尝试以下几点:
julia> l = @layout([a{0.1h} ;b [c; d e]])
Plots.GridLayout(2,1)

julia> p = plot(randn(100,5),layout=l,t=[:line :histogram :scatter :steppre :bar],leg=false,ticks=nothing,border=false)

julia> p.subplots
5-element Array{Plots.Subplot,1}:
 Subplot{1}
 Subplot{2}
 Subplot{3}
 Subplot{4}
 Subplot{5}

julia> fieldnames(p.subplots[1])
8-element Array{Symbol,1}:
 :parent
 :series_list
 :minpad
 :bbox
 :plotarea
 :attr
 :o
 :plt

julia> for i in 1:length(p.subplots)
           p.subplots[i].attr[:title] = "subtitle $i"
       end

julia> display(p)现在您应该在每个subplot中看到一个标题
页面原文内容由Stack Overflow提供。腾讯云小微IT领域专用引擎提供翻译支持
原文链接:
https://stackoverflow.com/questions/43066957
复制相关文章
相似问题
腾讯云开发者

Copyright © 2013 - 2026 Tencent Cloud. All Rights Reserved. 腾讯云 版权所有
深圳市腾讯计算机系统有限公司 ICP备案/许可证号:粤B2-20090059 ![]() 粤公网安备44030502008569号
粤公网安备44030502008569号
腾讯云计算(北京)有限责任公司 京ICP证150476号 | 京ICP备11018762号