
使用ggplot2在多个数据列上使用R中的小提琴绘图
使用ggplot2在多个数据列上使用R中的小提琴绘图
提问于 2017-03-27 15:17:06
我对R很陌生,我试着在每个取样深度上制作各种物种的小提琴图来统计数据。数据如下所示
    Depth Cd Cf Cl
1  3.6576  0  2  0
2  4.0000  2 13  0
3  4.2672  0  0  0
4 13.1064  0  2  0
5 14.0000  3 17 10
6 17.0000  0  0  0
物种在第2-5栏,深度在第一栏。我试图在R中使用ggplot2,但假设数据不是以ggplot2可以使用的方式组织的。理想情况下,我想要的深度是y轴和物种沿着x轴,每个小提琴的情节。谢谢你的帮助。亚历克斯
回答 2
Stack Overflow用户
回答已采纳
发布于 2017-03-28 07:03:47
首先重塑您的数据:
library(tidyverse)

my_dat2 <- my_dat %>%
  gather(species, val, -Depth) %>%
  slice(rep(row_number(), val)) %>%
  select(-val)

ggplot(my_dat2, aes(species, Depth)) +
  geom_violin()
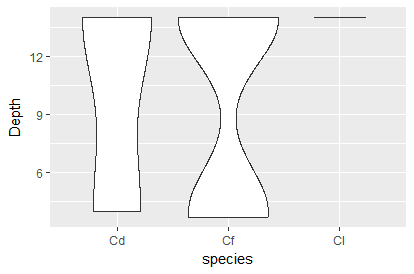
请注意,Cl只有一行,因为您只有单一深度。
Stack Overflow用户
发布于 2017-03-27 16:01:32
就像你已经怀疑的,你需要重塑你的数据。使用tidyr::gather将格式从"wide“更改为"long",这对于在x轴上绘制物种是必要的。此外,您需要扩展您可以使用slice实现的计数数据。
library(tidyverse)
zz <- "Depth Cd Cf Cl
1 3.6576 0 2 0
2 4.0000 2 13 0
3 4.2672 0 0 0
4 13.1064 0 2 0
5 14.0000 3 17 10
6 17.0000 0 0 0"
my_dat <- read.table(text = zz, header = T)
my_dat %>%
gather(species, val, -Depth) %>%
slice(rep(row_number(), val)) %>%
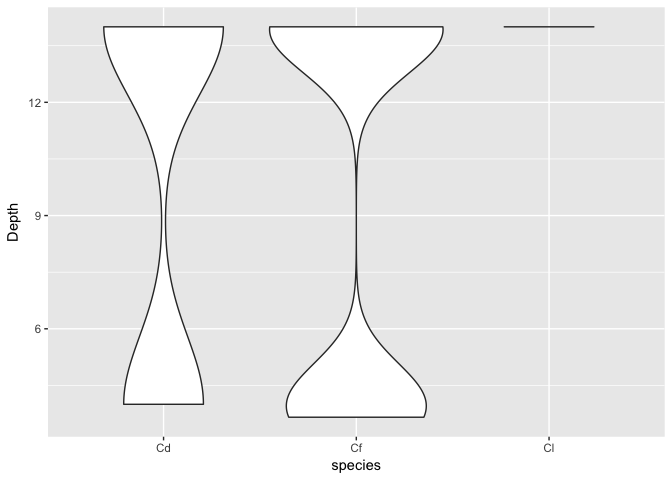
ggplot(aes(species, Depth)) +
geom_violin(adjust = .5)
页面原文内容由Stack Overflow提供。腾讯云小微IT领域专用引擎提供翻译支持
原文链接:
https://stackoverflow.com/questions/43050266
复制相关文章
相似问题
腾讯云开发者

Copyright © 2013 - 2026 Tencent Cloud. All Rights Reserved. 腾讯云 版权所有
深圳市腾讯计算机系统有限公司 ICP备案/许可证号:粤B2-20090059 ![]() 粤公网安备44030502008569号
粤公网安备44030502008569号
腾讯云计算(北京)有限责任公司 京ICP证150476号 | 京ICP备11018762号