
将renderUI输入从一个闪亮的模块传递到另一个模块
我试图模块化闪亮的代码,以上传CSV文件作为输入到scatterD3绘图。额外的UI控件将来自renderUI,以更改x变量和y变量.这只是来自How to organize large R Shiny apps?的Mikael回答的一个小小的修改,但我一直在挣扎,无法让这最后一点发挥作用。
对于这个数据集,我使用mtcar数据集469e9927/mtcars.csv。
## load libraries
library(shiny)
library(stringr)
library(scatterD3)

#source("/Users/echang/scratch/tmp/MSD_D3scatter/csvFile_Module.R")
csvFileInput <- function(id, label="CSV file") {
  ## Create namespace
  ns<-NS(id)
  tagList(
    uiOutput(ns("controls"))
  )
}

csvFileControl <- function(id){
  ns <- NS(id)
  tagList(
    column(width=3, uiOutput(ns("ColName"))),
    column(width=3, uiOutput(ns("ColEntry")))
  )
}

csvFileUI <- function(id){
  ns <- NS(id)
  tagList(
    uiOutput(ns("csvTable"))
  )
}

## server module
csvFile <- function(input, output, session, stringsAsFactors) {
  ns <- session$ns
  ## to reuse namespace, session must be first!!!

  ## User selected file
  userFile <- reactive({
    # If no file is selected, don't do anything
    validate(need(input$file, message = FALSE))
    input$file
  })

  dataframe <- reactive({
    read.csv(
      userFile()$datapath,
      header = input$header,
      sep=input$sep,
      quote = input$quote,
      stringsAsFactors = stringsAsFactors
    )
  })
  # We can run observers in here if we want to
  observe({
    msg <- sprintf("File %s was uploaded", userFile()$name)
    cat(msg, "\n")
  })

  output$controls <- renderUI({
    ## use taglist to keep everything together
    tagList(
      fileInput(ns('file'), 'Choose CSV file',
                accept=c('txt/csv','text/comma-separated-values,text/plain','.csv')),
      checkboxInput(ns('header'), 'Has heading', TRUE),
      radioButtons(ns('sep'),'Separator', c(Comma=',',Semicolon=';',Tab='\t'), ','),
      selectInput(ns('quote'),'Quote', c(None ='','Double Quote'='"','Single Quote'="'"),'"')
    )
  })

  ## use renderUI to display table
  output$csvTable <- renderUI({
    output$table <- renderDataTable(dataframe())
    dataTableOutput(ns("table"))
  })

  ## Column Name
  output$ColName <- renderUI({
    df <- dataframe()
    if (is.null(df)) return(NULL)
    items=names(df)
    names(items)=items
    tagList(
      selectInput(ns("xvar"), "Column Names", items),
      selectInput(ns("yvar"), "Column Names", items)
    )
  })

  ## Column Entry
  output$ColEntry <- renderUI({
    df <- dataframe()
    if (is.null(input$col)) return(NULL)
    tagList(
      selectInput(ns("entry"), "Entry Names", df[,input$xvar])
    )
  })

  # Return the reactive that yields the data frame
  return(dataframe)

}## End of module


## scatterD3 module -------------------------------------------------------------

D3scatterUI <- function(id){
  ns<-NS(id)
  tagList(
    scatterD3Output(ns("scatterplot1"))
    )
}

D3scatter <- function(input,output,session,data,xvar,yvar){
  ns <- session$ns

  output$scatterplot1 <- renderScatterD3({
    #scatterD3(data = data, x=mpg, y=carb,
    scatterD3(data = data, x=xvar, y=yvar,
              labels_size= 9, point_opacity = 1,
              #col_var=cyl, symbol_var= data$Assay,
              #lab= paste(mpg, carb, sep="|") , lasso=TRUE,
              #xlab= "IFN-γ", ylab= "IL-10",
              #click_callback = "function(id, index) {
              #  alert('scatterplot ID: ' + id + ' - Point index: ' + index)
              #  }",
              transitions= T)
  })
}


## Shiny ######################################################################
ui <- fluidPage(
  titlePanel("Upload"),

  tabsetPanel(type="tabs",
    tabPanel("tab1",
      sidebarLayout(
        sidebarPanel(csvFileInput("basic")),
        mainPanel(csvFileUI("basic"))
        )
      ),
    tabPanel("tab2",
      tagList(
        fluidRow(csvFileControl("basic")),
        fluidRow(D3scatterUI("first"))
        )
      )
    )
)

server <- function(input, output, session) {
  ## Option 1. CSV uploaded file
  datafile <- callModule(csvFile, "basic", stringsAsFactors = FALSE)

  ## Option 2. mtcar data loaded at start
  #datafile <- reactive({mtcars}) ## data loaded at runApp()
  #callModule(csvFile, "basic")

  xvar <- reactive(input$xvar)
  yvar <- reactive(input$yvar)

  callModule(D3scatter, "first", datafile(), xvar, yvar)

}

shinyApp(ui, server)我还参考了https://itsalocke.com/shiny-module-design-patterns-pass-module-input-to-other-modules/的闪亮模块设计。
我观看了网络研讨会,但无法正确理解我的逻辑。https://www.rstudio.com/resources/webinars/understanding-shiny-modules/任何帮助都将不胜感激!
回答 1
Stack Overflow用户
发布于 2017-03-27 11:50:22
好吧,这确实有点困难,因为使用模块并不是很简单。你们很亲密..。您的主要问题不是将reactives的全部打包到一个列表中,并将它们传递到需要它们的地方。
我做了以下修改:
csvFile:在csvFile服务器模块中声明了附加的反应性函数xvar和yvar,类似于您已经为dataframe所做的工作。csvFile:将所有所需的反应性打包为列表,并将其作为返回值返回,如文章中的设计模式链接所述。(谢谢你,斯蒂芬·洛克)server:将该列表向下传递到callModule(D3scatter,... )中,同样如该链接中所述。D3scatter:通过调用scatterD3来使用从指定数据中提取的向量来重构一点。这是因为我无法让它作为列说明符处理字符串(但肯定有一种方法)。
下面是上面更改的代码部分:
csvFile服务器模块
csvFile <- function(input, output, session, stringsAsFactors) {
  ns <- session$ns
  ## to reuse namespace, session must be first!!!

  ## User selected file
  userFile <- reactive({
    # If no file is selected, don't do anything
    validate(need(input$file, message = FALSE))
    input$file
  })

  dataframe <- reactive({
    read.csv(
      userFile()$datapath,
      header = input$header,
      sep=input$sep,
      quote = input$quote,
      stringsAsFactors = stringsAsFactors
    )
  })
  # We can run observers in here if we want to
  observe({
    msg <- sprintf("File %s was uploaded", userFile()$name)
    cat(msg, "\n")
  })

  xvar <- reactive({input[[ "xvar" ]] })
  yvar <- reactive({input[[ "yvar" ]] })

  output$controls <- renderUI({
    ## use taglist to keep everything together
    tagList(
      fileInput(ns('file'), 'Choose CSV file',
                accept=c('txt/csv','text/comma-separated-values,text/plain','.csv')),
      checkboxInput(ns('header'), 'Has heading', TRUE),
      radioButtons(ns('sep'),'Separator', c(Comma=',',Semicolon=';',Tab='\t'), ','),
      selectInput(ns('quote'),'Quote', c(None ='','Double Quote'='"','Single Quote'="'"),'"')
    )
  })

  ## use renderUI to display table
  output$csvTable <- renderUI({
    output$table <- renderDataTable(dataframe())
    dataTableOutput(ns("table"))
  })

  ## Column Name
  output$ColName <- renderUI({
    df <- dataframe()
    if (is.null(df)) return(NULL)
    items=names(df)
    print(items)
    names(items)=items
    tagList(
      selectInput(ns("xvar"), "Column Names", items),
      selectInput(ns("yvar"), "Column Names", items)
    )
  })

  ## Column Entry
  output$ColEntry <- renderUI({
    df <- dataframe()
    if (is.null(input$col)) return(NULL)
    tagList(
      selectInput(ns("entry"), "Entry Names", df[,input$xvar])
    )
  })

  rlist <- list(dataframe=dataframe,xvar=xvar,yvar=yvar)
  # Return the reactive that yields the data frame
  return(rlist)

}## End of module
服务器
server <- function(input, output, session) {
  ## Option 1. CSV uploaded file
  rlist <- callModule(csvFile, "basic", stringsAsFactors = FALSE)

  ## Option 2. mtcar data loaded at start
  #datafile <- reactive({mtcars}) ## data loaded at runApp()
  #callModule(csvFile, "basic")

  callModule(D3scatter, "first", rlist)

}
D3scatter
D3scatter <- function(input,output,session,rlist){
  ns <- session$ns

  output$scatterplot1 <- renderScatterD3({
    #scatterD3(data = data, x=mpg, y=carb,
    mtdf <- rlist$dataframe()
    x <- mtdf[[rlist$xvar()]]
    y <- mtdf[[rlist$yvar()]]
    scatterD3(x=x,y=y,
              labels_size= 9, point_opacity = 1,
              #col_var=cyl, symbol_var= data$Assay,
              #lab= paste(mpg, carb, sep="|") , lasso=TRUE,
              #xlab= "IFN-γ", ylab= "IL-10",
              #click_callback = "function(id, index) {
              #  alert('scatterplot ID: ' + id + ' - Point index: ' + index)
              #  }",
              transitions= T)
  })
}
然后它起了作用:
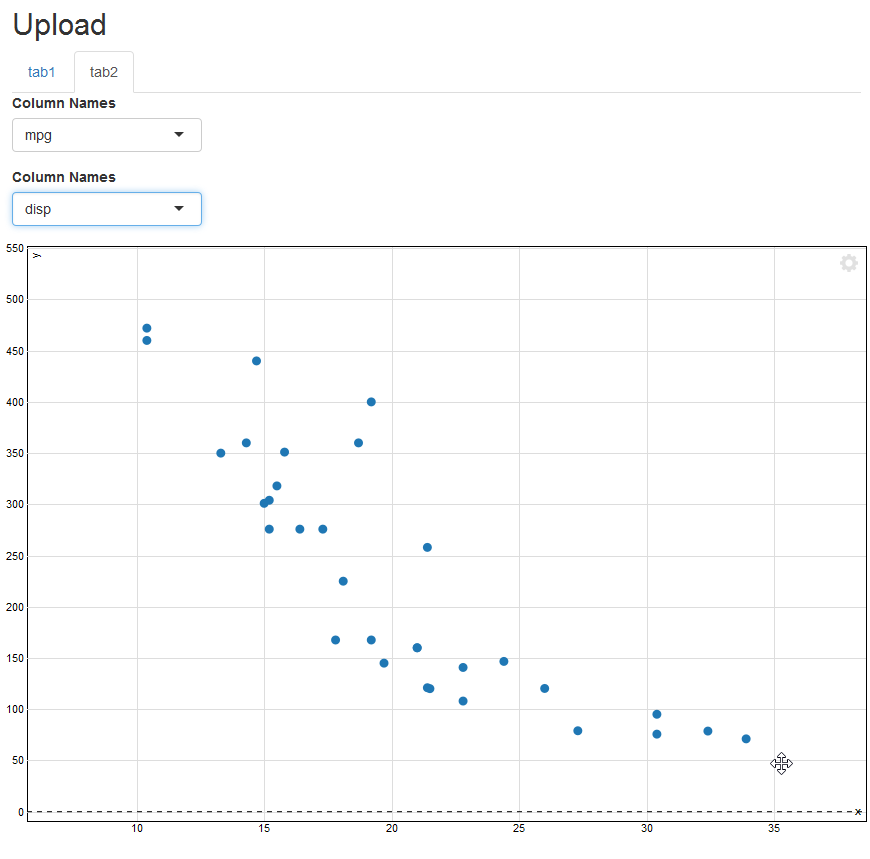
这是所有正在运行的代码,以防我忘了某个地方的更改,或者有人只想运行它。顺便说一下,散点图从一个点到另一个点变化的方式很酷.它不断地变形,具有动画般的效果。不同寻常。
一个文件中的整个应用程序
## load libraries
library(shiny)
library(stringr)
library(scatterD3)

#source("/Users/echang/scratch/tmp/MSD_D3scatter/csvFile_Module.R")
csvFileInput <- function(id, label="CSV file") {
  ## Create namespace
  ns<-NS(id)
  tagList(
    uiOutput(ns("controls"))
  )
}

csvFileControl <- function(id){
  ns <- NS(id)
  tagList(
    column(width=3, uiOutput(ns("ColName"))),
    column(width=3, uiOutput(ns("ColEntry")))
  )
}

csvFileUI <- function(id){
  ns <- NS(id)
  tagList(
    uiOutput(ns("csvTable"))
  )
}

## server module
csvFile <- function(input, output, session, stringsAsFactors) {
  ns <- session$ns
  ## to reuse namespace, session must be first!!!

  ## User selected file
  userFile <- reactive({
    # If no file is selected, don't do anything
    validate(need(input$file, message = FALSE))
    input$file
  })

  dataframe <- reactive({
    read.csv(
      userFile()$datapath,
      header = input$header,
      sep=input$sep,
      quote = input$quote,
      stringsAsFactors = stringsAsFactors
    )
  })
  # We can run observers in here if we want to
  observe({
    msg <- sprintf("File %s was uploaded", userFile()$name)
    cat(msg, "\n")
  })

  xvar <- reactive({input[[ "xvar" ]] })
  yvar <- reactive({input[[ "yvar" ]] })

  output$controls <- renderUI({
    ## use taglist to keep everything together
    tagList(
      fileInput(ns('file'), 'Choose CSV file',
                accept=c('txt/csv','text/comma-separated-values,text/plain','.csv')),
      checkboxInput(ns('header'), 'Has heading', TRUE),
      radioButtons(ns('sep'),'Separator', c(Comma=',',Semicolon=';',Tab='\t'), ','),
      selectInput(ns('quote'),'Quote', c(None ='','Double Quote'='"','Single Quote'="'"),'"')
    )
  })

  ## use renderUI to display table
  output$csvTable <- renderUI({
    output$table <- renderDataTable(dataframe())
    dataTableOutput(ns("table"))
  })

  ## Column Name
  output$ColName <- renderUI({
    df <- dataframe()
    if (is.null(df)) return(NULL)
    items=names(df)
    print(items)
    names(items)=items
    tagList(
      selectInput(ns("xvar"), "Column Names", items),
      selectInput(ns("yvar"), "Column Names", items)
    )
  })

  ## Column Entry
  output$ColEntry <- renderUI({
    df <- dataframe()
    if (is.null(input$col)) return(NULL)
    tagList(
      selectInput(ns("entry"), "Entry Names", df[,input$xvar])
    )
  })

  rlist <- list(dataframe=dataframe,xvar=xvar,yvar=yvar)
  # Return the reactive that yields the data frame
  return(rlist)

}## End of module


## scatterD3 module -------------------------------------------------------------

D3scatterUI <- function(id){
  ns<-NS(id)
  tagList(
    scatterD3Output(ns("scatterplot1"))
  )
}

D3scatter <- function(input,output,session,rlist){
  ns <- session$ns

  output$scatterplot1 <- renderScatterD3({
    #scatterD3(data = data, x=mpg, y=carb,
    mtdf <- rlist$dataframe()
    x <- mtdf[[rlist$xvar()]]
    y <- mtdf[[rlist$yvar()]]
    scatterD3(x=x,y=y,
              labels_size= 9, point_opacity = 1,
              #col_var=cyl, symbol_var= data$Assay,
              #lab= paste(mpg, carb, sep="|") , lasso=TRUE,
              #xlab= "IFN-γ", ylab= "IL-10",
              #click_callback = "function(id, index) {
              #  alert('scatterplot ID: ' + id + ' - Point index: ' + index)
              #  }",
              transitions= T)
  })
}


## Shiny ######################################################################
ui <- fluidPage(
  titlePanel("Upload"),

  tabsetPanel(type="tabs",
              tabPanel("tab1",
                       sidebarLayout(
                         sidebarPanel(csvFileInput("basic")),
                         mainPanel(csvFileUI("basic"))
                       )
              ),
              tabPanel("tab2",
                       tagList(
                         fluidRow(csvFileControl("basic")),
                         fluidRow(D3scatterUI("first"))
                       )
              )
  )
)

server <- function(input, output, session) {
  ## Option 1. CSV uploaded file
  rlist <- callModule(csvFile, "basic", stringsAsFactors = FALSE)

  ## Option 2. mtcar data loaded at start
  #datafile <- reactive({mtcars}) ## data loaded at runApp()
  #callModule(csvFile, "basic")

  callModule(D3scatter, "first", rlist)

}

shinyApp(ui, server)https://stackoverflow.com/questions/43038967
复制相似问题
腾讯云开发者

Copyright © 2013 - 2026 Tencent Cloud. All Rights Reserved. 腾讯云 版权所有
深圳市腾讯计算机系统有限公司 ICP备案/许可证号:粤B2-20090059 ![]() 粤公网安备44030502008569号
粤公网安备44030502008569号
腾讯云计算(北京)有限责任公司 京ICP证150476号 | 京ICP备11018762号