
如何将dotPlot(seqinr)函数应用于含蛋白序列载体的每一个可能的成对组合
如何将dotPlot(seqinr)函数应用于含蛋白序列载体的每一个可能的成对组合
提问于 2017-03-11 14:46:59
我是新来的,我非常感谢你的帮助。我想将dotPlot(seqinr)函数应用于包含3个蛋白序列的载体中的两个蛋白质序列的每一个组合。这意味着我想得到3个dotPlot图表在最后。我尝试使用for循环:
#this is the vector containing 3 protein sequences. I turned each sequence to string to get 3 character vector:
seqs<-c(c2s(lepraeseq),c2s(ulceransseq),c2s(protseq))

#the loop:
for(i in 1:(length(seqs)-1)){
for(j in (i+1):length(seqs)){
print(dotPlot(as.character(i),as.character(j)))}}

#the outcome:
NULL
NULL
NULL
很明显,这是错误的,我正在努力寻找正确的道路。我和j是整数,我想让它们成为向量,把序列作为字符,我只是不知道怎么做。
如果有人有其他方式,我会很高兴收到它。谢谢,贝拉
回答 1
Stack Overflow用户
回答已采纳
发布于 2017-03-12 02:23:22
我无法访问lepraeseq、ulceransseq等中的数据,但这应该有效。您需要使用combn创建一个具有所有可能组合的索引对象。
使用此索引,您可以在一个循环中生成您的绘图。我看你在窗户上。我在你的硬盘上加了一行来保存你的情节。
library(seqinr)
seqs<-c("lepraeseq","ulceransseq","protseq")
comb <-combn(length(seqs),2) #get all possible pairwise combinations
for (i in 1:ncol(comb)){
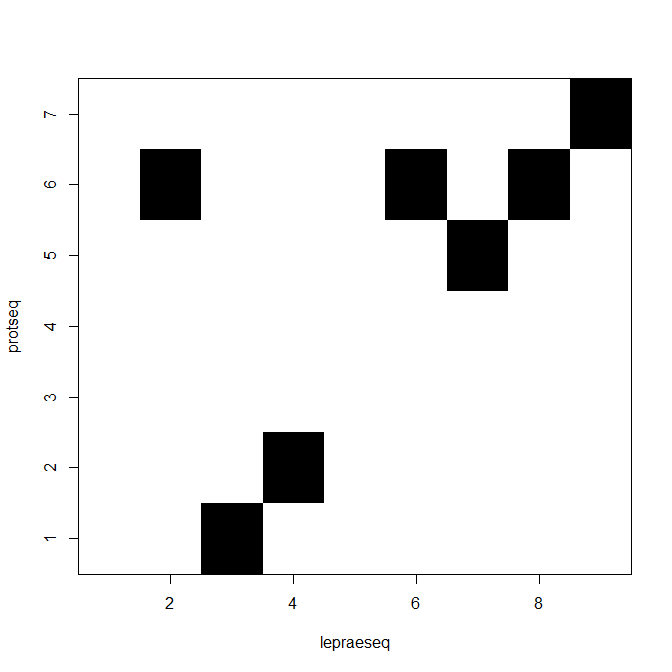
dotPlot(s2c(seqs[comb[1,i]]),s2c(seqs[comb[2,i]]),
xlab=seqs[comb[1,i]],ylab=seqs[comb[2,i]])
savePlot(filename = paste0("c:/temp/",paste0(seqs[comb[1,i]],"-",seqs[comb[2,i]]),".png"),
type ="png")
}
页面原文内容由Stack Overflow提供。腾讯云小微IT领域专用引擎提供翻译支持
原文链接:
https://stackoverflow.com/questions/42736547
复制相关文章
相似问题
腾讯云开发者

Copyright © 2013 - 2026 Tencent Cloud. All Rights Reserved. 腾讯云 版权所有
深圳市腾讯计算机系统有限公司 ICP备案/许可证号:粤B2-20090059 ![]() 粤公网安备44030502008569号
粤公网安备44030502008569号
腾讯云计算(北京)有限责任公司 京ICP证150476号 | 京ICP备11018762号