
交互情节
交互情节
提问于 2017-03-08 14:23:34
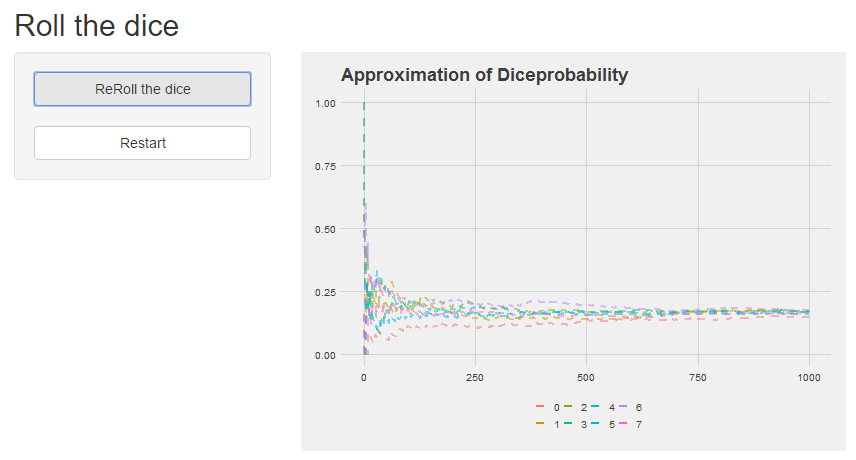
我正试图构建一个闪亮的应用程序,重新定位一个6边的骰子。A有2个动作按钮。我想要实现的是,每次单击reroll按钮都会在相同的(!!)上添加另一个概率线。阴谋。
每条概率线都应该是另一种颜色(因此,如果你点击它30次,你会看到30种不同颜色的6线作为结果)。
使用“重新启动”按钮,您可以擦除图中所有打印的图形,可以从头开始尝试(因此,如果一行是altime打印的,也可以)。
这是我迄今所创造的:
library(ggplot2)
library(ggthemes)
library(extrafont)

ui <- fluidPage(

# Application title
titlePanel("Roll the dice"),

# Sidebar with a go_button and a restart_button
sidebarLayout(
sidebarPanel(
  actionButton("reroll",
               "ReRoll the dice",
               width = "100%"),
  br(),
  br(),

  actionButton("restart",
               "Restart",
               width = "100%")
),

# Show a plot
mainPanel(
  plotOutput("plot")
  )
 )
)

server <- function(input, output) {

output$plot <- renderPlot({

input$reroll

a <- 1:6
b <- 1:1000
eyes <- sample(a,1000,replace=T)
six <- eyes == 6
c <- cumsum(six) / 1:1000
df <- data.frame(b , c)


gl <- geom_line(aes(x = b , y = c), size = 0.9, linetype="dashed", colour = "red", alpha = 0.5)

p <-  ggplot(data = df) +
      xlim(0, 1000) +
      ylim(0, 1) +
      labs(x="Number of Throws", y="Probability of 6") +
      ggtitle("Approximation of Diceprobability") +

      theme_fivethirtyeight() + scale_colour_fivethirtyeight() +
      theme(axis.title = element_text(family="Atlas Grotesk Regular"),
              legend.position="bottom", legend.direction="horizontal",
              legend.title=element_blank(),
              plot.title=element_text(family="Atlas Grotesk Medium"),
              legend.text=element_text(family="Atlas Grotesk Regular"),
              text=element_text(family="DecimaMonoPro"))

p + gl

 })
}

shinyApp(ui=ui, server = server)
问题:
- 我如何在同一地块中绘制不同的线条(你知道.我按了30次,它在同一地块中建了30行)
- 我怎么能编程它,每一行有另一种颜色?
- 我怎么能用我的重新启动按钮“擦除”它,然后再试一次?
我很乐意在那里提供每一个帮助:)
非常感谢。
回答 2
Stack Overflow用户
发布于 2017-03-08 15:21:40
- 使用
observeEvent触发按钮。 - 使用
reactiveValues存储绘图和颜色计数器。 - 不要使用那个颜色刻度,因为它只有三种颜色。
保持ui的原样,然后制作server
server <- function(input, output) {
  # start plot
  p_blank <- ggplot() +
    xlim(0, 1000) +
    ylim(0, 1) +
    labs(x="Number of Throws", y="Probability of 6") +
    ggtitle("Approximation of Diceprobability") +
    theme_fivethirtyeight() +
    theme(legend.position="bottom", legend.direction="horizontal",
          legend.title=element_blank())

  #reactive values
  reac <- reactiveValues()
  reac$p_lines <- p_blank
  reac$counter <- 0

  # button functionality
  observeEvent(input$reroll,
               {
                 input$reroll
                 a <- 1:6
                 b <- 1:1000
                 eyes <- sample(a,1000,replace=T)
                 six <- eyes == 6
                 c <- cumsum(six) / 1:1000
                 df <- data.frame(b, c, counter = reac$counter)
                 gl <- geom_line(aes(x = b , y = c, col = factor(counter)), df,
                                 size = 0.9,  linetype="dashed", alpha = 0.5)
                 reac$p_lines <- reac$p_lines + gl
                 reac$counter <- reac$counter + 1
               })

  observeEvent(input$restart,
               {
                 reac$p_lines <- p_blank
                 reac$counter <- 0
               } )

  # draw the plot
  output$plot <- renderPlot(reac$p_lines)
}
Stack Overflow用户
发布于 2017-03-08 15:02:25
我不知道你到底想做什么,但是:
- 要更新一个绘图,我将设置一个包含您的绘图对象的反应性值。然后,我会使用和observeEventto手表按钮按下。在此事件中添加新行。
- 然后,您可以为另一个按钮创建一个observeEvent,用空图替换您的绘图对象。
页面原文内容由Stack Overflow提供。腾讯云小微IT领域专用引擎提供翻译支持
原文链接:
https://stackoverflow.com/questions/42673890
复制相关文章
相似问题
腾讯云开发者

Copyright © 2013 - 2026 Tencent Cloud. All Rights Reserved. 腾讯云 版权所有
深圳市腾讯计算机系统有限公司 ICP备案/许可证号:粤B2-20090059 ![]() 粤公网安备44030502008569号
粤公网安备44030502008569号
腾讯云计算(北京)有限责任公司 京ICP证150476号 | 京ICP备11018762号