
非矩形区域上的Python 3D绘图
非矩形区域上的Python 3D绘图
提问于 2017-03-04 14:16:52
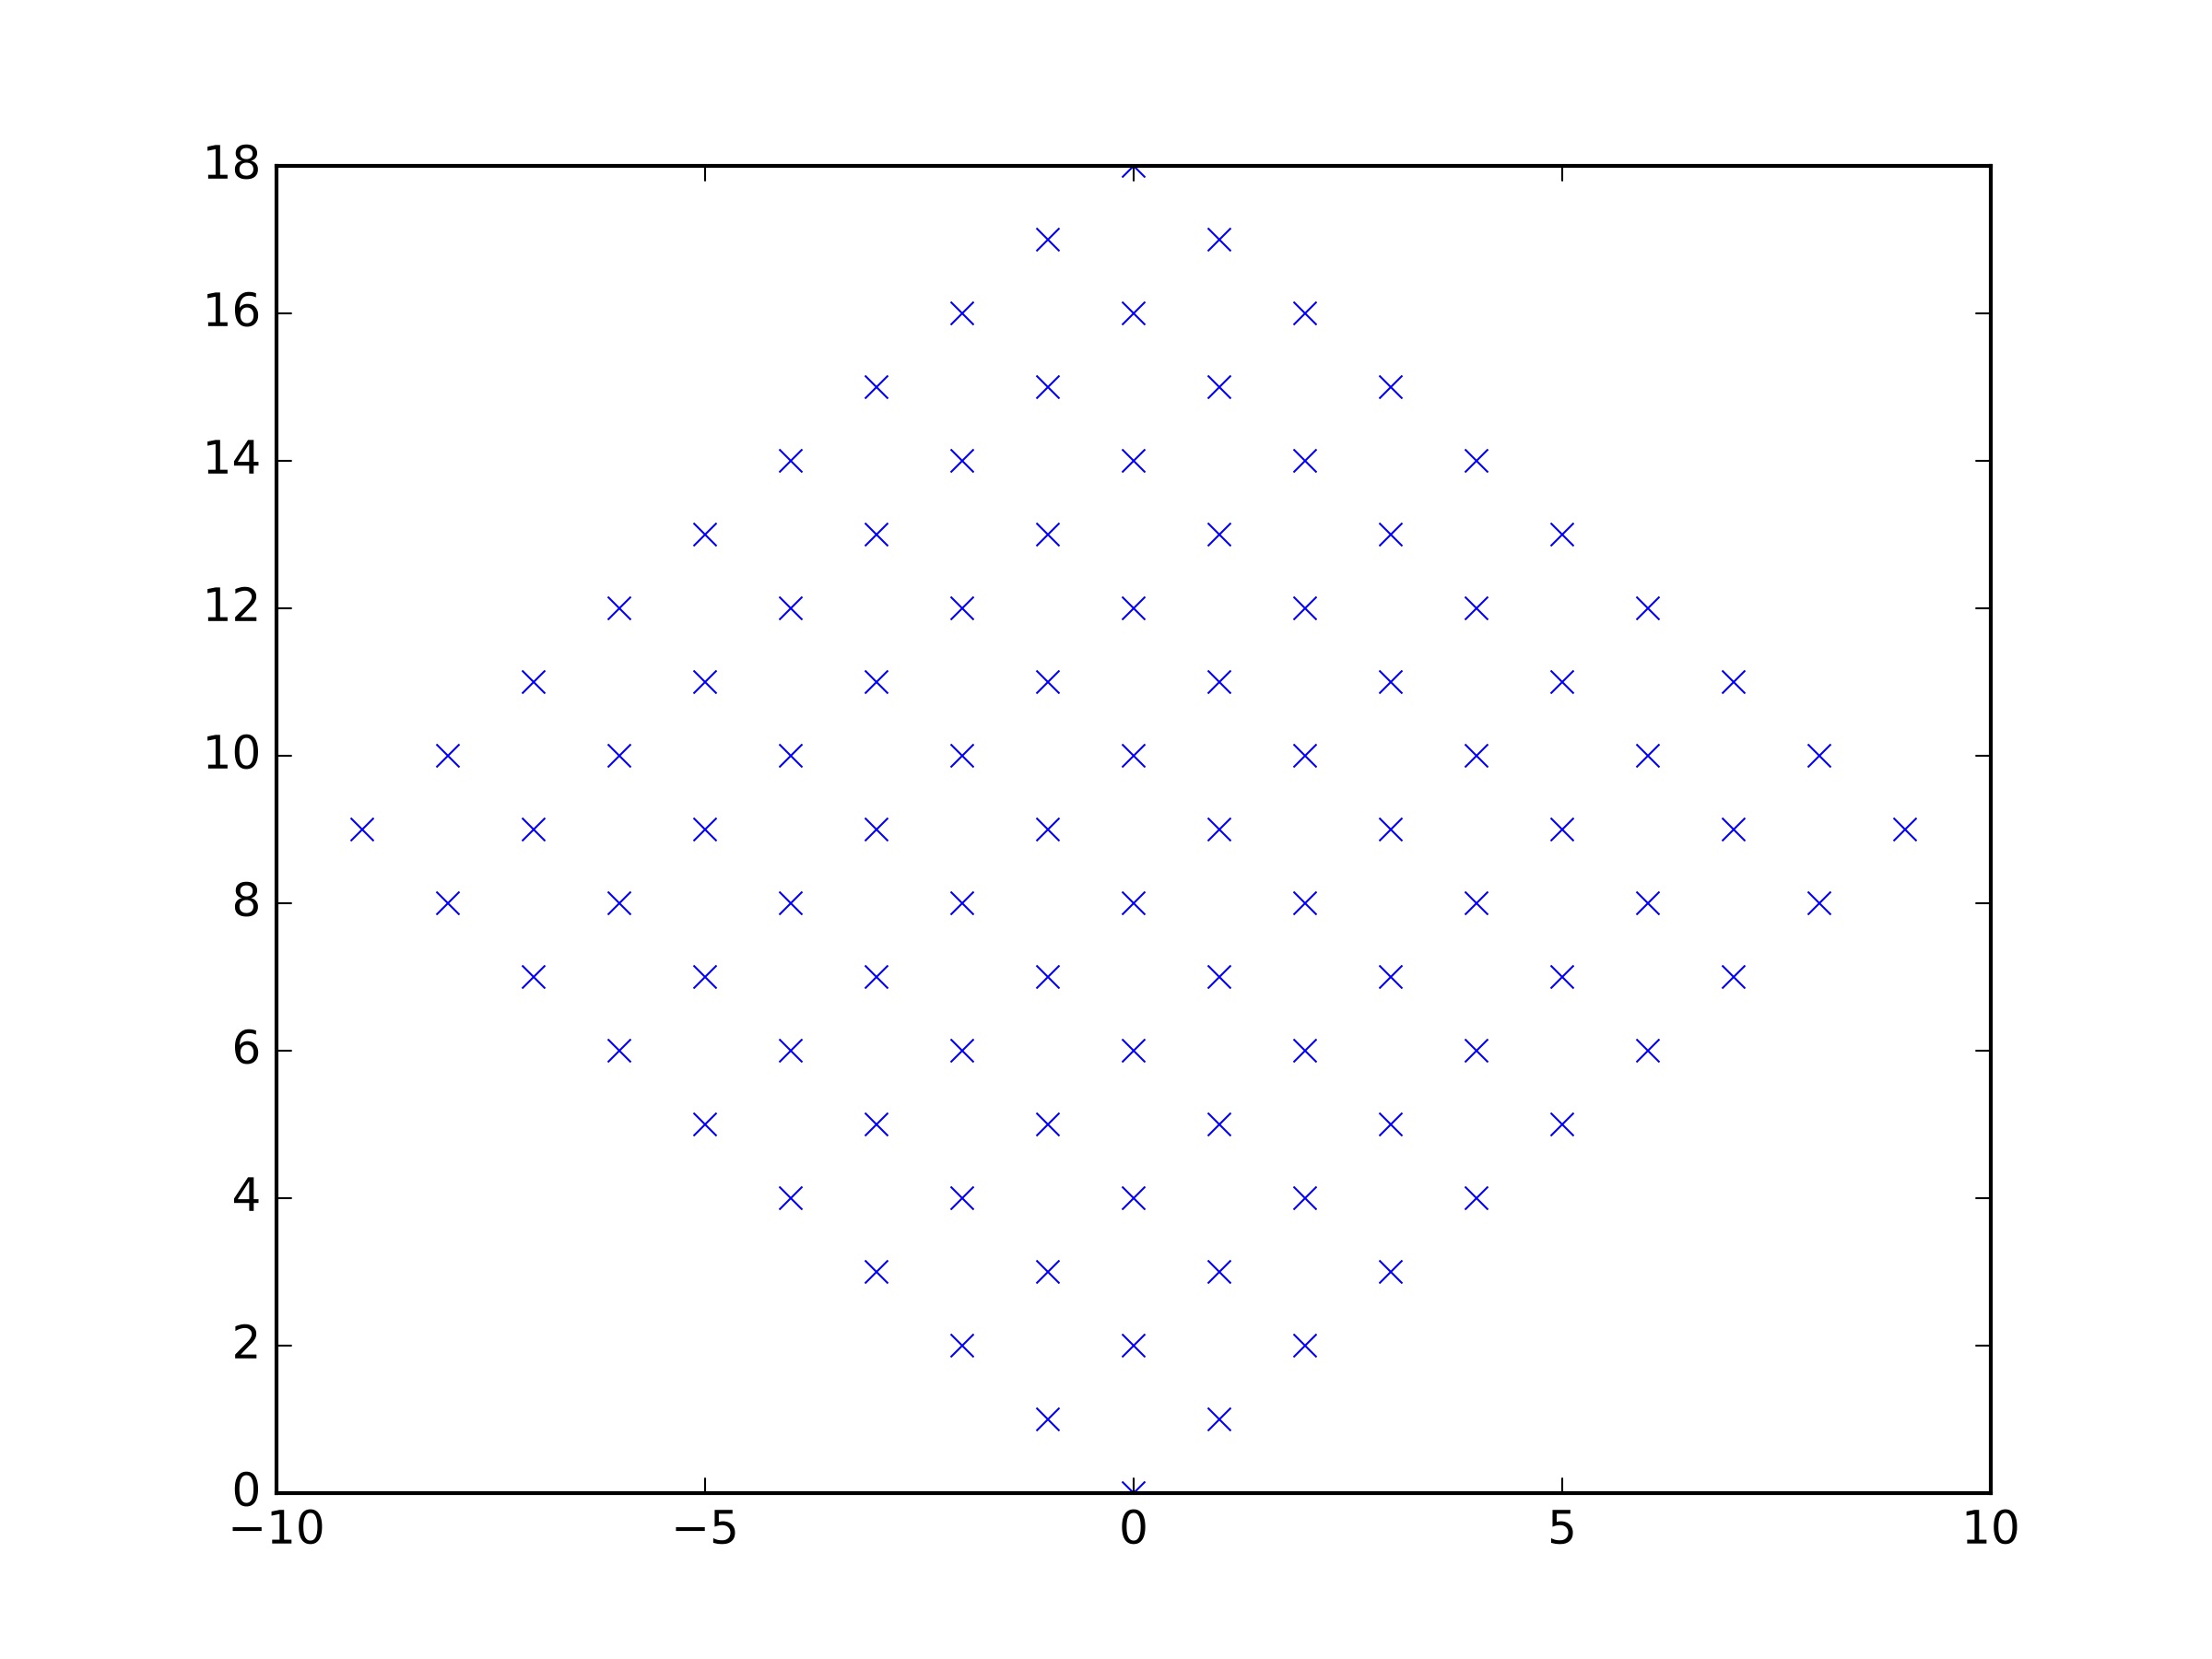
我有一些z=f(x,y)数据,我想要绘制。问题是,(x,y)不是“好的”矩形的一部分,而是任意的平行图,如所附图像所示(这个特定的矩形也是一个矩形,但您可以考虑更一般的情况)。因此,我很难弄清楚如何在本例中使用plot_surface,因为这通常将x和y作为2d数组,而这里的x值和y值是1d。谢谢。
回答 2
Stack Overflow用户
回答已采纳
发布于 2017-03-04 14:37:51
简化点可以作为一维数组提供给matplotlib.Axes3D.plot_trisurf。它们是否遵循特定的结构并不重要。
将取决于数据结构的其他方法如下
- 插值规则矩形网格上的点。这可以使用
scipy.interpolate.griddata来实现。参见示例这里 - 重新构造输入数组,使其驻留在常规数组上,然后使用
plot_surface()。这取决于提供点的顺序,对于具有“并行”形状的网格来说,这可能是一个非常简单的解决方案。 从球体实例中可以看出,plot_surface()也适用于网格形状非常不均匀的情况,只要它是以常规方式构造的。
下面是一些示例:
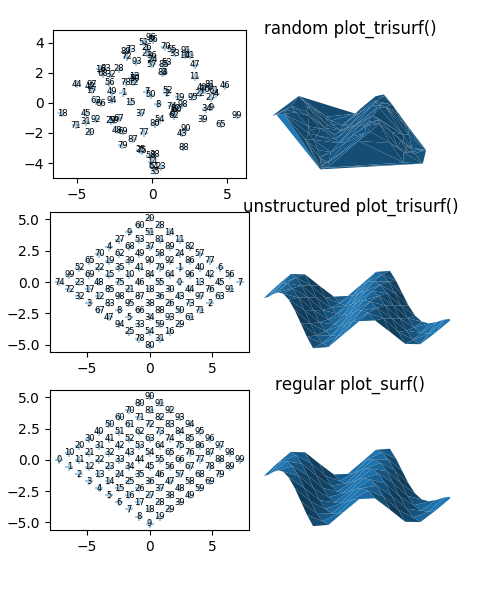
为了完整,请在这里找到生成上述图像的代码:
import matplotlib.pyplot as plt
from mpl_toolkits.mplot3d import Axes3D
import numpy as np

f = lambda x,y: np.sin(x+0.4*y)*0.23+1

fig = plt.figure(figsize=(5,6))
plt.subplots_adjust(left=0.1, top=0.95,wspace=0.01)


ax0 = fig.add_subplot(322, projection="3d")

ma = 6*(np.random.rand(100)-0.5)
mb = 6*(np.random.rand(100)-0.5)
phi = np.pi/4
x = 1.7*ma*np.cos(phi) + 1.7*mb*np.sin(phi)
y = -1.2*ma*np.sin(phi) +1.2* mb*np.cos(phi)
z = f(x,y)
ax0.plot_trisurf(x,y,z)

ax1 = fig.add_subplot(321)
ax0.set_title("random plot_trisurf()")
ax1.set_aspect("equal")
ax1.scatter(x,y, marker="+", alpha=0.4)
for i  in range(len(x)):
    ax1.text(x[i],y[i], i  , ha="center", va="center", fontsize=6)


n = 10
a = np.linspace(-3, 3, n)
ma, mb = np.meshgrid(a,a)
phi = np.pi/4
xm = 1.7*ma*np.cos(phi) + 1.7*mb*np.sin(phi)
ym = -1.2*ma*np.sin(phi) +1.2* mb*np.cos(phi)
shuf = np.c_[xm.flatten(), ym.flatten()]
np.random.shuffle(shuf)
x = shuf[:,0]
y = shuf[:,1]
z = f(x,y)

ax2 = fig.add_subplot(324, projection="3d")
ax2.plot_trisurf(x,y,z)

ax3 = fig.add_subplot(323)
ax2.set_title("unstructured plot_trisurf()")
ax3.set_aspect("equal")
ax3.scatter(x,y, marker="+", alpha=0.4)
for i  in range(len(x)):
    ax3.text(x[i],y[i], i  , ha="center", va="center", fontsize=6)


x = xm.flatten()
y = ym.flatten()
z = f(x,y)

X = x.reshape(10,10)
Y = y.reshape(10,10)
Z = z.reshape(10,10)

ax4 = fig.add_subplot(326, projection="3d")
ax4.plot_surface(X,Y,Z)

ax5 = fig.add_subplot(325)
ax4.set_title("regular plot_surf()")
ax5.set_aspect("equal")
ax5.scatter(x,y, marker="+", alpha=0.4)
for i  in range(len(x)):
    ax5.text(x[i],y[i], i  , ha="center", va="center", fontsize=6)


for axes in [ax0, ax2,ax4]:
    axes.set_xlim([-3.5,3.5])
    axes.set_ylim([-3.5,3.5])
    axes.set_zlim([0.9,2.0])
    axes.axis("off")
plt.savefig(__file__+".png")
plt.show()Stack Overflow用户
发布于 2017-03-04 14:40:31
如果您的数据是有序的,并且您知道并行图的大小,那么重塑可能就足够了:
ax.surface(x.reshape(10, 10), y.reshape(10, 10), z.reshape(10, 10))如果平行四边形的两边各有10个点,并且这些点是按字形排列的,就可以工作了。
页面原文内容由Stack Overflow提供。腾讯云小微IT领域专用引擎提供翻译支持
原文链接:
https://stackoverflow.com/questions/42597026
复制相关文章
相似问题
腾讯云开发者

Copyright © 2013 - 2026 Tencent Cloud. All Rights Reserved. 腾讯云 版权所有
深圳市腾讯计算机系统有限公司 ICP备案/许可证号:粤B2-20090059 ![]() 粤公网安备44030502008569号
粤公网安备44030502008569号
腾讯云计算(北京)有限责任公司 京ICP证150476号 | 京ICP备11018762号