
geom_line图形上y轴的比例尺被打包
我正在制作一个R标记文件,使用对冲基金数据为一个金融计量经济学类分配。我的作业定于周二完成,但我在pdf_document中的数字呈现方式上有一些问题。
```{r Q4}图书馆(Dplyr)
图书馆(Ggplot2)
图书馆(天平)
hedgefunds.long <- hedgefunds.long %>% group_by(战略) %>%变异(RET= (log(NAV)-滞后(log(NAV)* 100)
ggplot(hedgefunds.long) + geom_line(aes(x = date,y= RET)) + scale_y_continuous(breaks=pretty_breaks(n=6)) + facet_wrap(~策略,ncol = 2)
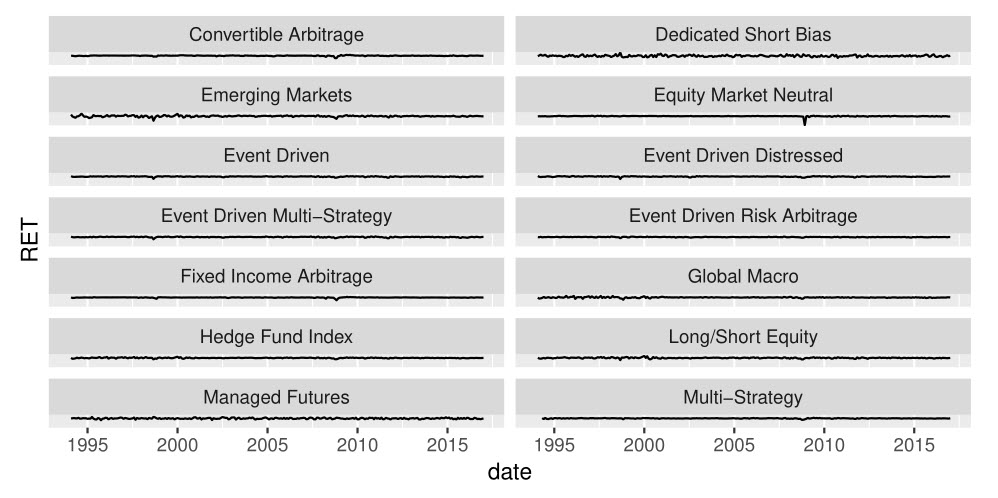
Another issue I am having is that bits are cut off when the pdf document is knitted. I was wondering if there was a way to make sure that the legend in the picture below is not cut off at the top and bottom.
[watch the labels on the axes](https://i.stack.imgur.com/MBF3z.jpg)
edit: (changed corrplot a bit, still haven't figure out resizing)
```javascriptaddgrid.col = "gray50",tl.cex = 0.8,tl.offset = 0.5,tl.col =“黑色”)
head on each dataset,

```javascript> head(hedgefunds, 10)A级老虎: 10×15
date `Hedge Fund Index` `Convertible Arbitrage` `Dedicated Short Bias` <date> <dbl> <dbl> <dbl>一九九三年一日-12-31 100.00 100.00 100.00
1994-01-31 101.14 100.36 98.40
1994-02-28 97.00 100.51 100.37
1994-03-31 93.54 99.54 107.59
1994年5月-04-30 91.91 97.03 108.97
1994年6月-05-31 93.96 96.04 111.42
1994年7月-06-30 93.20 96.24 118.49
1994年8月-07-31 93.53 96.37 117.09
1994年9月-08-31 96.12 96.33 110.46
1994年10月-09-30 96.76 95.18 112.20
..。增加11个变量:Emerging Markets,“股票市场”
中性<dbl>,事件驱动的<dbl>,事件驱动的不良<dbl>,事件
驱动多策略<dbl>,事件驱动风险套利<dbl>,固定
收益套利<dbl>,Global Macro<dbl>,多头/空头股票
Managed Futures,Multi-Strategy
头(hedgefunds.long,10)
资料来源:本地数据框架10 x4。
集团:战略1
date Strategy NAV RET <date> <chr> <dbl> <dbl>1993年1日-12-31对冲基金指数100.00 NA
1994-01-31对冲基金指数101.14 1.1335510
1994-02-28对冲基金指数97.00 -4.1794717
1994-03-31对冲基金指数93.54 -3.6321826
1994-04-30对冲基金指数91.91 -1.7579315
1994-05-31对冲基金指数93.96 2.2059322
1994-06-30对冲基金指数93.20 -0.8121438
1994年8月07-31对冲基金指数93.53 0.3534519
1994年9月-08-31对冲基金指数96.12 2.7315170
1994-09-30对冲基金指数96.76 0.6636275
图书馆(Tidyr)
hedgefunds.long <- tidyr::hedgefunds(对冲基金,策略,NAV,-date)
将尝试这一点,并查看它是否works...will编辑文章,如果它这样做。坐标标号的r-变化尺寸
回答 1
Stack Overflow用户
发布于 2017-02-27 07:54:01
我没有一个可重复的数据来检查,但在我看来,数字大小太小,迫使你的数字堆在一起。
左右播放您的图形窗口大小,特别是Q4中的高度,也考虑facet_wrap(~ Strategy, ncol = 2)中的ncol > 2;Q8的宽度和高度。
可以添加fig.width和fig.height‘{r fig.width=x,fig.height=y}
{r Q4, fig.width=7, fig.height=10} # plot()
如果数字大小不能修复它,则可以设置页边距。
# ggplot margins
gg + theme(plot.margin = unit(c(t,r,b,l), "cm")) # replace t,r,b,l with appropriate values
# plot margins
par(mar=c(b,l,t,r)) # replace b,l,t,r with appropriate values
plot()https://stackoverflow.com/questions/42479615
复制相似问题
腾讯云开发者

Copyright © 2013 - 2026 Tencent Cloud. All Rights Reserved. 腾讯云 版权所有
深圳市腾讯计算机系统有限公司 ICP备案/许可证号:粤B2-20090059 ![]() 粤公网安备44030502008569号
粤公网安备44030502008569号
腾讯云计算(北京)有限责任公司 京ICP证150476号 | 京ICP备11018762号