
在实际的Scatter3d()图中添加特定行
在实际的Scatter3d()图中添加特定行
提问于 2017-02-17 15:20:33
我有一个实际的Scatter3d()图,我想在其中一些图之间画线。从物理上讲,我有一个网络,其中有些节点与键相连,我想画出这些键。我该怎么做?
Scatter3d()附带了一个mode='lines+markers'选项,使其成为点对点散点图,而不是默认的仅点图。这不是我要找的。我希望提供一个对xyz坐标的列表,并在末尾提供一个行集合。
下面是我绘制一个简单的Scatter3d()图的函数:
def Splot3dPlotly(xyz):
'''
3D scatter plot using Plotly.

:param xyz: (NPx3) array of xyz positions
:return: A Plotly figure that can now be plotted as usual.
'''
xyz = np.reshape(xyz, (int(xyz.size/3), 3))
NN = int(sqrt(xyz.shape[0]))

trace1 = go.Scatter3d(
    x=xyz[:,0],
    y=xyz[:,1],
    z=xyz[:,2],
    mode = 'markers', # 'lines+markers',
    marker=dict(color=range(NN*NN), colorscale='Portland')
            )

data = [trace1]
layout = go.Layout(
    margin=dict(
        l=0,
        r=0,
        b=0,
        t=0
    )
)

fig = go.Figure(data=data, layout=layout)
return fig回答 1
Stack Overflow用户
回答已采纳
发布于 2017-02-17 15:59:48
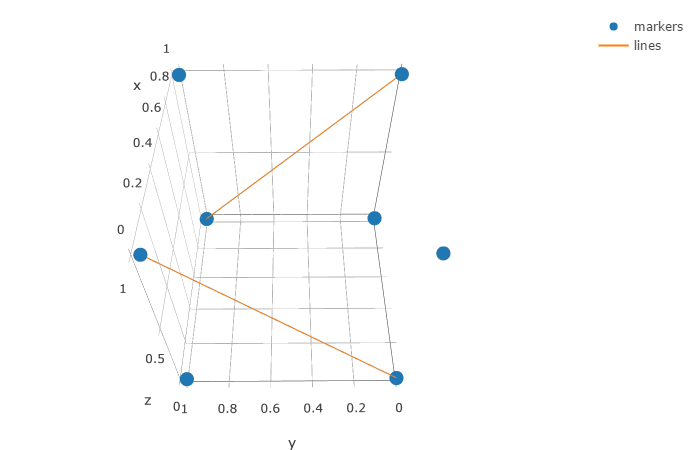
您可以用线条添加第二个跟踪,每个坐标对由None分隔,以防止Plotly连接跟踪。
import plotly.graph_objs as go
import plotly
plotly.offline.init_notebook_mode()

#draw a square
x = [0, 1, 0, 1, 0, 1, 0, 1]
y = [0, 1, 1, 0, 0, 1, 1, 0]
z = [0, 0, 0, 0, 1, 1, 1, 1]

#the start and end point for each line
pairs = [(0,6), (1,7)]

trace1 = go.Scatter3d(
    x=x,
    y=y,
    z=z,
    mode='markers',
    name='markers'
)

x_lines = list()
y_lines = list()
z_lines = list()

#create the coordinate list for the lines
for p in pairs:
    for i in range(2):
        x_lines.append(x[p[i]])
        y_lines.append(y[p[i]])
        z_lines.append(z[p[i]])
    x_lines.append(None)
    y_lines.append(None)
    z_lines.append(None)

trace2 = go.Scatter3d(
    x=x_lines,
    y=y_lines,
    z=z_lines,
    mode='lines',
    name='lines'
)

fig = go.Figure(data=[trace1, trace2])
plotly.offline.iplot(fig, filename='simple-3d-scatter')
页面原文内容由Stack Overflow提供。腾讯云小微IT领域专用引擎提供翻译支持
原文链接:
https://stackoverflow.com/questions/42301481
复制相关文章
相似问题
腾讯云开发者

Copyright © 2013 - 2026 Tencent Cloud. All Rights Reserved. 腾讯云 版权所有
深圳市腾讯计算机系统有限公司 ICP备案/许可证号:粤B2-20090059 ![]() 粤公网安备44030502008569号
粤公网安备44030502008569号
腾讯云计算(北京)有限责任公司 京ICP证150476号 | 京ICP备11018762号