
使用tmap在形状上弹出
我制作了一个地图,取消tmap,包括在一个闪亮的应用程序使用leaflet。我大致有我想要的:一个基于SpatialPolygonsDataFrame的填充颜色的主题地图,当你点击该地图时,会弹出一个关于多边形的额外信息。我想改变弹出以获得一个更好的布局时,点击。默认情况下,将显示dataset中的名称,但它并不真正是用户友好的。
这里是一个可重复的例子。
library(tmap)
library(leaflet)

data(Europe)

tmap_mode("view")
carte <- tm_shape(Europe) +
  tm_borders(alpha = 0.5) +
  tm_fill(col = "well_being",
          id = "name",
          popup.vars = c("life_exp","well_being"))
tmap_leaflet(carte)我试图命名向量(popup.vars = c("Life Expectancy" = "life_exp", "Well being" = "well_being),但这不起作用)。
我还尝试在调用leaflet::addPolygons时添加弹出窗口,但我得到了一条错误消息。
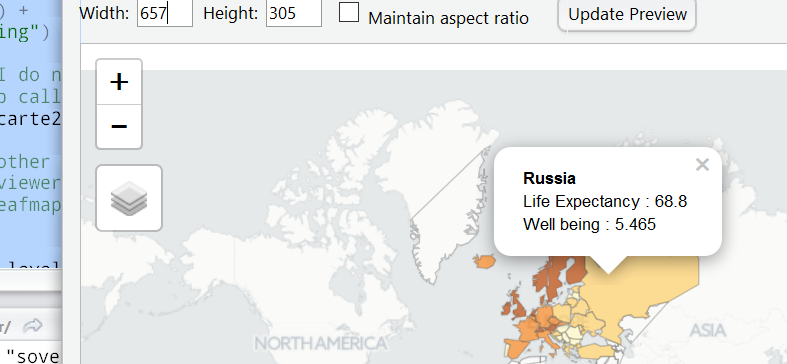
carte2 <- tm_shape(Europe) +
  tm_borders(alpha = 0.5) +
  tm_fill(col = "well_being")

nom <- Europe$name

tmap_leaflet(carte2) %>%
  addPolygons(layerId = nom,
    popup = paste0("<b>",~name,"</b><br/>Life Expectancy : ",
                           ~life_exp," <br/>Well being : ", ~well_being))
derivePolygons中的错误(数据、lng、lat、缺失(Lng)、缺失(Lat)、" addPolygons "):多边形数据未找到;请向addPolygons提供数据和/或lng/lat参数。
谢谢
回答 2
Stack Overflow用户
发布于 2017-02-11 20:25:07
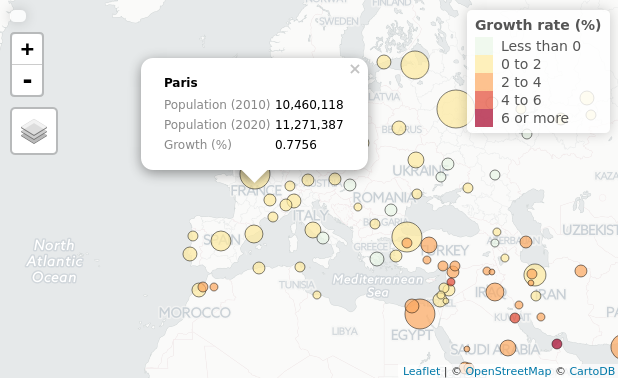
在开发版本中,popup.vars的向量名称现在被用作标签。此外,我还向每个层函数添加了popup.format。可以分别为每个变量指定数字格式。
data(World, metro)
metro$growth <- (metro$pop2020 - metro$pop2010) / (metro$pop2010 * 10) * 100

ttm()
tm_shape(metro) +
    tm_bubbles("pop2010", col = "growth",
               border.col = "black", border.alpha = .5,
               style="fixed", breaks=c(-Inf, seq(0, 6, by=2), Inf),
               palette="-RdYlBu", contrast=1,
               title.size="Metro population",
               title.col="Growth rate (%)", id="name",
               popup.vars=c("Population (2010)"="pop2010", "Population (2020)"="pop2020", "Growth (%)"="growth"),
               popup.format=list(growth=list(digits=4)))
Stack Overflow用户
发布于 2017-01-31 15:17:30
免责声明:黑客
首先,我要警告您,这是一次黑客攻击,但是代码应该可以实现您的目标。也许,在tmap回购上提交一个问题,以获得其他弹出选项。
library(tmap)

data(Europe)

carte2 <- tm_shape(Europe) +
  tm_borders(alpha = 0.5) +
  tm_fill(col = "well_being")

# this is a hack, since I do not see a clean mechanism to accomplish
# look at the leaflet map calls for addPolygons
leafmap <- tmap_leaflet(carte2)

# if you are ok using another package
# install.packages("listviewer")
# listviewer::jsonedit(leafmap$x$calls)

# if not then
str(leafmap$x$calls, max.level=2)

# addPolygons is the call we need to adjust
#  in this example it is the fourth call
str(leafmap$x$calls[[4]], max.level=2)
# the popups are the fifth element of the args
leafmap$x$calls[[4]]$args[[5]]
# adjust these how you like
leafmap$x$calls[[4]]$args[[5]] <- leaflet:::evalFormula(
  ~paste0(
    "<b>",name,"</b><br/>",
    "Life Expectancy : ", life_exp,
    " <br/>Well being : ", format(well_being, digits=4)
  ),
  data=Europe
)

# warned this is a hack
https://stackoverflow.com/questions/41940403
复制相似问题
腾讯云开发者

Copyright © 2013 - 2026 Tencent Cloud. All Rights Reserved. 腾讯云 版权所有
深圳市腾讯计算机系统有限公司 ICP备案/许可证号:粤B2-20090059 ![]() 粤公网安备44030502008569号
粤公网安备44030502008569号
腾讯云计算(北京)有限责任公司 京ICP证150476号 | 京ICP备11018762号