
在R中编写自己的kmeans算法
我试着用R写我自己的第一个write算法,我是这个领域的新手,所以请不要因为看不到显而易见的东西而对我进行评判。
在当前状态下,该算法采用两个向量x,y,计算每个数据点到聚类中心的距离,并以最小距离分配聚类中心到数据点的距离。当分配不发生变化,聚类中心不变时,算法停止。
# Sample data
set.seed(100)
xval <- rnorm(12, mean = rep(1:3, each = 4), sd = 0.2)
yval <- rnorm(12, mean = rep(c(1,2,1), each = 4), sd = 0.2)

# Kmeans function
kclus <- function(x, y, nclus) {

    # start with random cluster centers
    xcen <- runif(n = nclus, min = min(x), max = max(x))
    ycen <- runif(n = nclus, min = min(y), max = max(y))

    # data points and cluster assignment in "data"
    # cluster coordinates in "clus"
    data <- data.frame(xval = x, yval = y, clus = NA)
    clus <- data.frame(name = 1:nclus, xcen = xcen, ycen = ycen)

    finish <- FALSE

    while(finish == FALSE) {

        # assign cluster with minimum distance to each data point
        for(i in 1:length(x)) {
            dist <- sqrt((x[i]-clus$xcen)^2 + (y[i]-clus$ycen)^2)
            data$clus[i] <- which.min(dist)
        }

        xcen_old <- clus$xcen
        ycen_old <- clus$ycen

        # calculate new cluster centers
        for(i in 1:nclus) {
            clus[i,2] <- mean(subset(data$xval, data$clus == i))
            clus[i,3] <- mean(subset(data$yval, data$clus == i))
        }

        # stop the loop if there is no change in cluster coordinates
        if(identical(xcen_old, clus$xcen) & identical(ycen_old, clus$ycen)) finish <- TRUE
    }
    data
}

# apply kmeans function to sample data
cluster <- kclus(xval, yval, 4)

# plot the result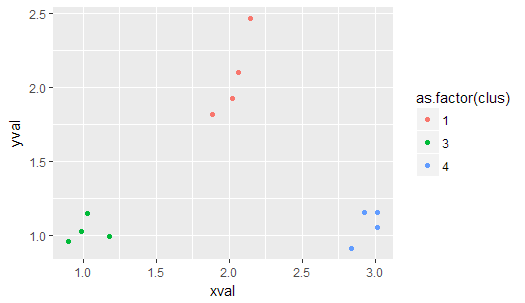
ggplot(cluster, aes(xval, yval, color = as.factor(clus))) + geom_point()到目前为止,这是比较好的工作。但是我不知道,我怎样才能强制算法到一个特定数目的簇。它已经实现为参数nclus在我的kclus()函数,但我不知道如何使用它。
对于给定的样本数据,算法只给出三个聚类。我想逼他把四组分还给我。
有谁能给我提个建议吗?
非常感谢你,马库斯
回答 2
Stack Overflow用户
发布于 2017-01-28 18:17:35
这是不正确的,你实现的算法总是给你三个集群,你可能没有运行它足够多的次数。下面是对代码的轻微修改,我们将能够看到集群输出的数量取决于集群质心的初始化(这些中心是随机选择的,可以用random.seed控制):
# Sample data
set.seed(100)
xval <- rnorm(12, mean = rep(1:3, each = 4), sd = 0.2)
yval <- rnorm(12, mean = rep(c(1,2,1), each = 4), sd = 0.2)
# Kmeans function with random.seed for initialization
kclus <- function(x, y, nclus, random.seed=123) {
set.seed(random.seed)
# start with random cluster centers
xcen <- runif(n = nclus, min = min(x), max = max(x))
ycen <- runif(n = nclus, min = min(y), max = max(y))
# data points and cluster assignment in "data"
# cluster coordinates in "clus"
data <- data.frame(xval = x, yval = y, clus = NA)
clus <- data.frame(name = 1:nclus, xcen = xcen, ycen = ycen)
finish <- FALSE
while(finish == FALSE) {
# assign cluster with minimum distance to each data point
for(i in 1:length(x)) {
dist <- sqrt((x[i]-clus$xcen)^2 + (y[i]-clus$ycen)^2)
data$clus[i] <- which.min(dist)
}
xcen_old <- clus$xcen
ycen_old <- clus$ycen
# calculate new cluster centers
for(i in 1:nclus) {
clus[i,2] <- mean(subset(data$xval, data$clus == i))
clus[i,3] <- mean(subset(data$yval, data$clus == i))
}
# stop the loop if there is no change in cluster coordinates
if(identical(xcen_old, clus$xcen) & identical(ycen_old, clus$ycen)) finish <- TRUE
}
data
}
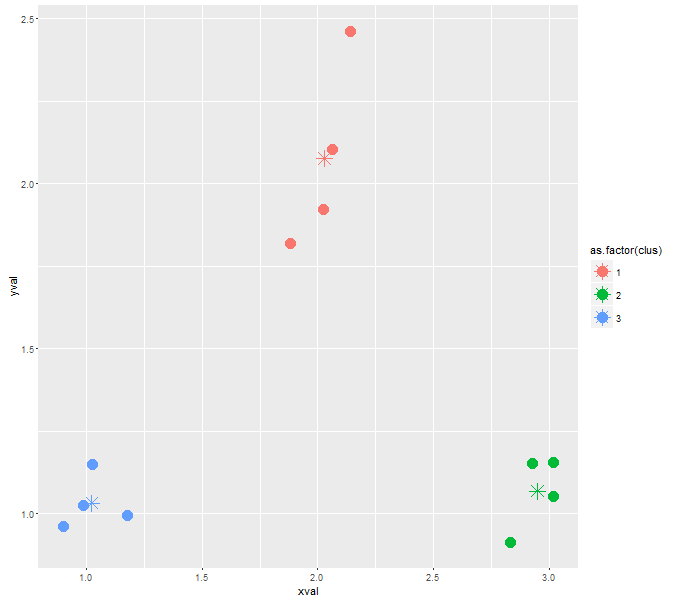
# with default random seed 123, you should be able to reproduce the result
# as you can see, in this case, no data points were assigned to the 4th cluster
cluster <- kclus(xval, yval, 4)
cluster.centers <- aggregate(.~clus, cluster, mean)
ggplot(cluster, aes(xval, yval, color = as.factor(clus))) +
geom_point(size=5) +
geom_point(data=cluster.centers, aes(xval, yval, col=as.factor(clus)), pch=8, size=5)
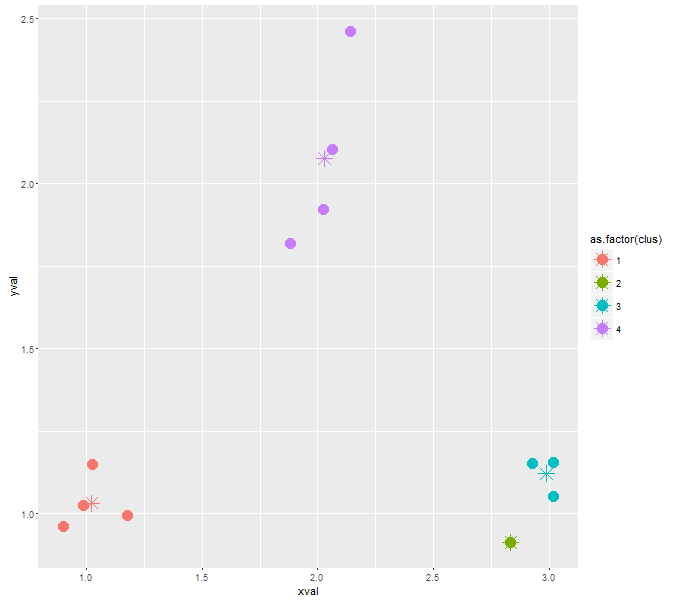
# run with a different random seed = 12
# as you can see, in this case, the algorithm outputs 4 clusters, with the 2nd cluster having a single datapoint assigned to
    cluster <- kclus(xval, yval, 4, 12)
    cluster.centers <- aggregate(.~clus, cluster, mean)
    ggplot(cluster, aes(xval, yval, color = as.factor(clus))) +
      geom_point(size=5) +
      geom_point(data=cluster.centers, aes(xval, yval, col=as.factor(clus)), pch=8, size=5)
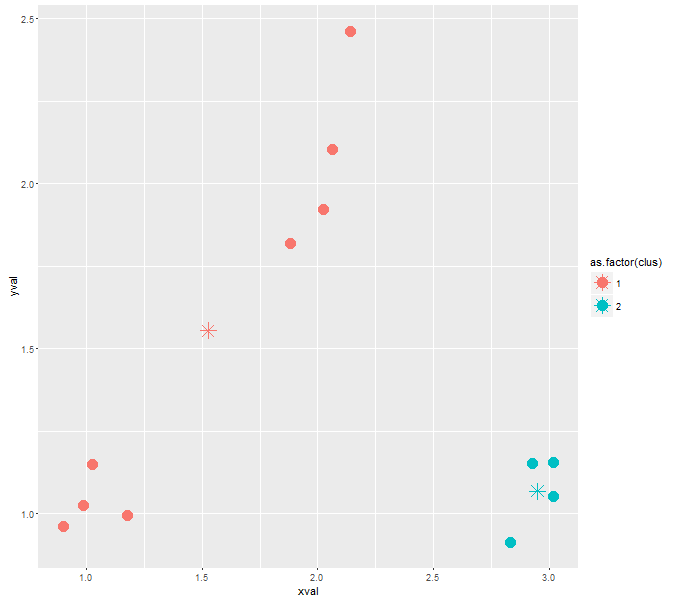
# run with a different random seed = 12345
# as you can see, in this case, the algorithm outputs 2 clusters, with the all the datapoints assigned to the 1st and the 2nd cluster
    cluster <- kclus(xval, yval, 4, 12345)
    cluster.centers <- aggregate(.~clus, cluster, mean)
    ggplot(cluster, aes(xval, yval, color = as.factor(clus))) +
      geom_point(size=5) +
      geom_point(data=cluster.centers, aes(xval, yval, col=as.factor(clus)), pch=8, size=5)
从上面的例子中我们可以看到,一个簇是否在收敛时没有分配给它的点取决于初始的中心位置和数据的分布。通常,如果kmeans将一个集群质心作为空,这意味着如果您试图向空集群强制分配一个点,它可能会导致质量较差的集群,这是您不想做的事情。
在这一点上,你可以尝试几件事。
- 首先,您可以多次运行算法,每次使用不同的随机初始化中心,然后选择具有最高聚类质量的结果(由SSE等度量)。
- 您可以尝试的第二件事是使用Kmeans++进行更智能的初始化。
- 一个不太好的选择可能是修改您的算法,以确保在重新分配集群的同时,它保证每个k (=4)集群至少有一个点被分配给它(如果没有,就不要重新分配)。
- 最后,您可以尝试其他一些算法,例如分层聚类,它通过dendogram提供了更大的灵活性,可以选择任意数量的集群。
Stack Overflow用户
发布于 2017-02-23 19:24:39
问题是你的初始化。
使用随机数初始化是最糟糕的选择,除非数据是均匀随机分布的(然后就没有集群)。
现在,如果在左上角生成一个中心,它可能有0分,然后您的代码可能会生成一个NaN平均值next。
相反,尝试从数据中选择k点作为中心。这样做的可能性要小得多(尽管可以)。
https://stackoverflow.com/questions/41912875
复制相似问题
腾讯云开发者

Copyright © 2013 - 2026 Tencent Cloud. All Rights Reserved. 腾讯云 版权所有
深圳市腾讯计算机系统有限公司 ICP备案/许可证号:粤B2-20090059 ![]() 粤公网安备44030502008569号
粤公网安备44030502008569号
腾讯云计算(北京)有限责任公司 京ICP证150476号 | 京ICP备11018762号