
如何在Simulink Matlab中测量导纳?
我需要在我的RLC中测量准入。有什么聪明的办法吗?我知道有专门的阻抗测量块,我能利用它吗?
回答 1
Stack Overflow用户
发布于 2017-01-27 02:44:35
首先,我要重申比古里在他的评论中提出的建议。在堆栈溢出上发布之前,您应该尝试通过自己的方法(使用文档)解决问题,如果没有成功,则发布一个提供更多细节的问题。这样,更多的用户将能够帮助你,你将得到更好的答案。
这是一种无需使用阻抗测量块的方法:
首先,我使用Simscape Power Systems专用技术基础块库(powerlib)中的以下块创建了一个RLC电路的powerlib模型:
- 交流电压源
- 电流测量
- 系列RLC分支
- Powergui
除了交流电压源块和串联RLC支路块外,还需要电流测量块和Powergui模块才能工作。
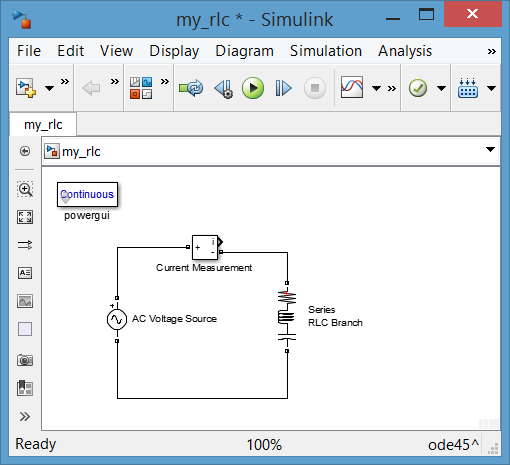
由于您没有为电路组件提供任何特定的值,所以我使用的是默认值。
然后我将模型命名为my_rlc,并将其保存在我的工作目录中。
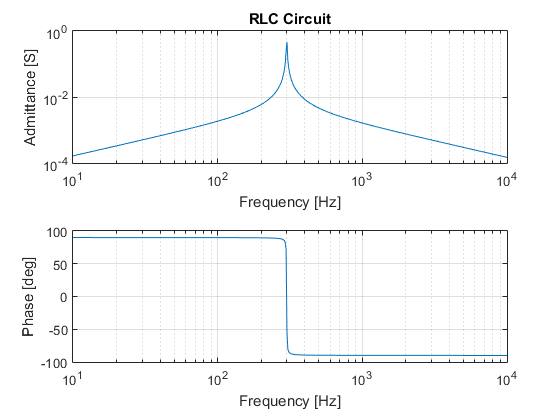
最后,我创建了以下脚本(受这个例子的启发),该脚本利用power_analyze函数获得电路的状态空间模型 (my_rlc),从而获得导纳。由于RLC电路的特性随频率的变化而变化,我利用bode函数得到了10 Hz到10 kHz频率范围内导纳的大小和相位。
% Analyze electric circuit.
% Obtain the matrices (A,B,C,D) of the state-space model of the circuit.
[A, B, C, D] = power_analyze('my_rlc');

% Generate logarithmically spaced vector of frequency values.
% 500 points between decades 10^1 and 10^4.
freq = logspace(1, 4, 500);

% Vector of angular frequency values.
w = 2*pi*freq;

% Magnitude and phase of frequency response.
% Ymag: Admittance magnitude.
% Yphase: Admittance phase.
[Ymag, Yphase] = bode(A, B, C, D, 1, w);

% Plot Admittance magnitude.
subplot(2, 1, 1);
loglog(freq, Ymag);
grid on;
title('RLC Circuit');
xlabel('Frequency [Hz]');
ylabel('Admittance [S]');

% Plot Admittance phase.
subplot(2, 1, 2);
semilogx(freq, Yphase);
xlabel('Frequency [Hz]');
ylabel('Phase [deg]');
grid on;
其结果是:
如果您想了解更多关于在MATLAB中使用状态空间模型的知识,我鼓励您阅读:什么是状态空间模型?。
https://stackoverflow.com/questions/41859544
复制相似问题
腾讯云开发者

Copyright © 2013 - 2026 Tencent Cloud. All Rights Reserved. 腾讯云 版权所有
深圳市腾讯计算机系统有限公司 ICP备案/许可证号:粤B2-20090059 ![]() 粤公网安备44030502008569号
粤公网安备44030502008569号
腾讯云计算(北京)有限责任公司 京ICP证150476号 | 京ICP备11018762号