
如何改变直方图条形图的顺序
如何改变直方图条形图的顺序
提问于 2017-01-18 15:39:08
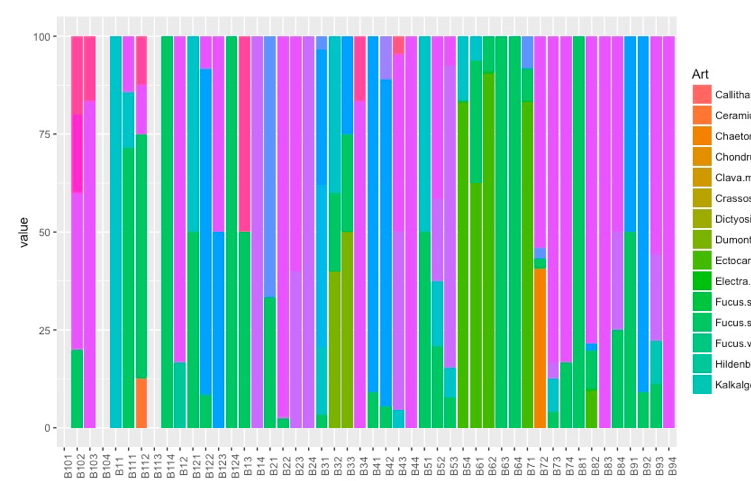
我试图手动更改直方图条形图的顺序,但无法实现。有人能帮我吗?
我想把下面的第一个数字放在一起: 1-8-12,2-7-11,3-6-10和4-5-9。
我还试图将颜色更改为另一个调色板,但没有成功。如果有人能帮我找到正确的代码,我会很感激的。
dsv <- read.csv("mydata.csv",sep=";",dec=",",header=TRUE,row.names=1)
dsv$Diatomeer <- NULL
tdsv <- t(dsv)
pdsv <- prop.table(as.matrix(tdsv),margin=2)
sum(pdsv)
tpdsv <- pdsv*100
plotdsv <- melt(tpdsv)
head(plotdsv)
colnames(plotdsv) <- c("Art","Basseng","value")
ggplot(plotdsv,aes(x=Basseng,y=value,ymin=0,ymax=value,fill=Art))+
  geom_bar(stat="identity")+
theme(axis.text.x=element_text(angle=90))回答 1
Stack Overflow用户
发布于 2017-01-19 14:06:21
为了染色,试试这个
my_pal <- c(RColorBrewer::brewer.pal(9, 'Set1'),
RColorBrewer::brewer.pal(8, 'Set2'))稍后在ggplot中添加
scale_colour_manual(values=my_pal)页面原文内容由Stack Overflow提供。腾讯云小微IT领域专用引擎提供翻译支持
原文链接:
https://stackoverflow.com/questions/41723455
复制相关文章
相似问题
腾讯云开发者

Copyright © 2013 - 2026 Tencent Cloud. All Rights Reserved. 腾讯云 版权所有
深圳市腾讯计算机系统有限公司 ICP备案/许可证号:粤B2-20090059 ![]() 粤公网安备44030502008569号
粤公网安备44030502008569号
腾讯云计算(北京)有限责任公司 京ICP证150476号 | 京ICP备11018762号