
网格太小,不能用于kernelUD /getverticeshr/adehabitatHR家程估计
AD生境HR文档建议在创建UD对象后计算95%的主范围内核的代码:
 ## Calculation of the 95 percent home range
    ver <- getverticeshr(ud, 95)
对于我的一些数据,会出现以下错误:
Error in getverticeshr.estUD(x[[i]], percent, ida = names(x)[i], unin,  :
  The grid is too small to allow the estimation of home-range.
You should rerun kernelUD with a larger extent parameter
在Nabble论坛上,人们建议更改“网格”和“范围”输入,但是在使用这两个参数的许多组合之后,我无法获得更好的结果。有什么建议吗?
回答 1
Stack Overflow用户
发布于 2018-03-06 02:57:16
这是我在一些论坛上发现的一个常见问题。但答案很简单,准确地反映在错误信息中。“你需要扩大你的网格”。这是因为当您应用getverticeshr(ud, 95)时,多边形的一部分超出了网格,因此不可能得到一个区域。例如,在下面的代码中,KDE被估计为两种假设的动物。我使用0到100之间的随机点,所以我定义了一个网格100x100 (域)。
#"""
# Language: R script
# This is a temporary script file.
#"""

# 1. Packages
library(adehabitatHR)         # Package for spatal analysis

# 2. Empty Dataframe
points <- data.frame(ID = double())
XY_cor <- data.frame(X = double(),
                     Y = double())
# 3. Assigning values (this will be our spatial coordinates)
set.seed(17)
for(i in c(1:100)){
    if(i >= 50){points[i, 1] <- 1}
    else {points[i, 1] <- 2}
    XY_cor[i, 1] <- runif(1, 0, 100)
    XY_cor[i, 2] <- runif(1, 0, 100)}

# 4. Transform to SpatialDataframe
coordinates(points) <- XY_cor[, c("X", "Y")]
class(points)

# 5. Domain
x <- seq(0, 100, by=1.) # resolution is the pixel size you desire
y <- seq(0, 100, by=1.)
xy <- expand.grid(x=x,y=y)
coordinates(xy) <- ~x+y
gridded(xy) <- TRUE
class(xy)

# 6. Kernel Density
kud_points <- kernelUD(points, h = "href", grid = xy)
image(kud_points)

# 7. Get the Volum
vud_points <- getvolumeUD(kud_points)

# 8. Get contour
levels <- c(50, 75, 95)
list <- vector(mode="list", length = 2)

list[[1]] <- as.image.SpatialGridDataFrame(vud_points[[1]])
list[[2]] <- as.image.SpatialGridDataFrame(vud_points[[2]])

# 9. Plot
par(mfrow = c(2, 1))
image(vud_points[[1]])
contour(list[[1]], add=TRUE, levels=levels)
image(vud_points[[2]])
contour(list[[2]], add=TRUE, levels=levels)
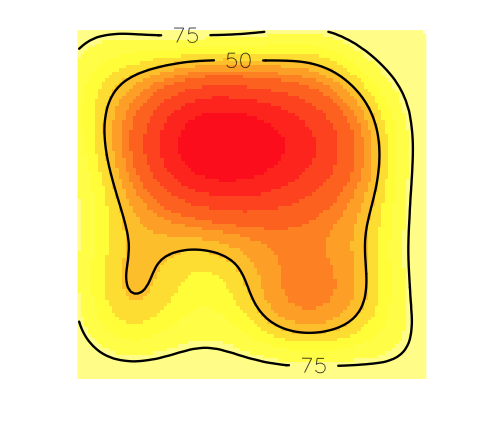
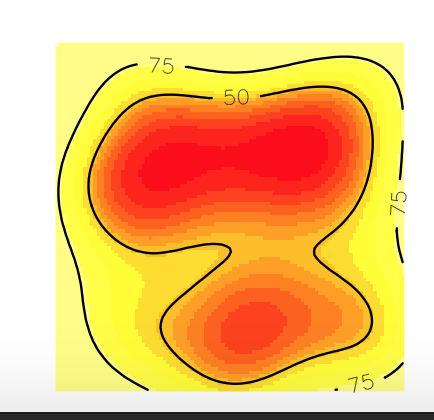
图中显示,50%的等高线在网格内,而75%的等高线被切割,这意味着其中的一部分被删除了。
如果您尝试将KDE的顶点估计为50%,您将得到一个很好的结果:
# 10. Get vertices (It will be fine)
vkde_points <- getverticeshr(kud_points, percent = 50,
                                 unin = 'm', unout='m2')
plot(vkde_points)但是,如果尝试使用75%的级别,就会得到经典的错误:getverticeshr.estUD中的错误(x[i],%,ida =name(X)i,unin ):网格太小,无法估计归属范围。您应该使用更大的范围参数kernelUD重新运行。
# 10. Get vertices (Will be an Error)
vkde_points <- getverticeshr(kud_points, percent = 75,
                                 unin = 'm', unout='m2')
plot(vkde_points)
现在,您可以清楚地看到正在发生的事情,R不能将顶点估计为75%,因为它们在网格之外,所以您需要增加域(网格)!在这里,我将在50中增加域(参见# 5.域)
# 5. Domain                 HERE GRID IS INCREASED 50 AT X AND Y!!
x <- seq(-50, 150, by=1.) # resolution is the pixel size you desire
y <- seq(-50, 150, by=1.)
xy <- expand.grid(x=x,y=y)
coordinates(xy) <- ~x+y
gridded(xy) <- TRUE
class(xy)

# 6. Kernel Density
kud_points <- kernelUD(points, h = "href", grid = xy)
image(kud_points)

# 7. Get the Volum
vud_points <- getvolumeUD(kud_points)

# 8. Get contour
levels <- c(50, 75, 95)
list <- vector(mode="list", length = 2)

list[[1]] <- as.image.SpatialGridDataFrame(vud_points[[1]])
list[[2]] <- as.image.SpatialGridDataFrame(vud_points[[2]])

# 9. Plot
par(mfrow = c(2, 1))
image(vud_points[[1]])
contour(list[[1]], add=TRUE, levels=levels)
image(vud_points[[2]])
contour(list[[2]], add=TRUE, levels=levels)
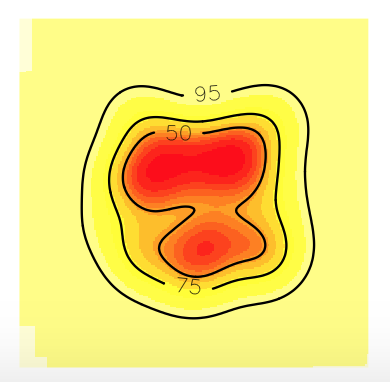
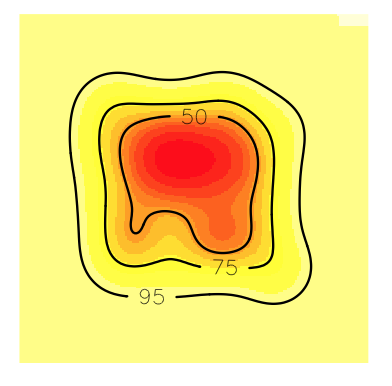
您可以看到所有的等高线都在网格(域)中。所以,现在你可以估计顶点了。
# 10. Get vertices
vkde_points <- getverticeshr(kud_points, percent = 75,
                                 unin = 'm', unout='m2')
plot(vkde_points)https://stackoverflow.com/questions/41683905
复制相似问题
腾讯云开发者

Copyright © 2013 - 2026 Tencent Cloud. All Rights Reserved. 腾讯云 版权所有
深圳市腾讯计算机系统有限公司 ICP备案/许可证号:粤B2-20090059 ![]() 粤公网安备44030502008569号
粤公网安备44030502008569号
腾讯云计算(北京)有限责任公司 京ICP证150476号 | 京ICP备11018762号