
绘制Pandas中的不同邮政编码房价中值的timeseries数据
我已经从当地的地铁名单上下载了数据,我想分析这个地区不同的市场趋势。我有分析地铁网站趋势的工具,但我想更熟悉使用Pandas和matplotlib绘图。
目前,这就是我所拥有的。
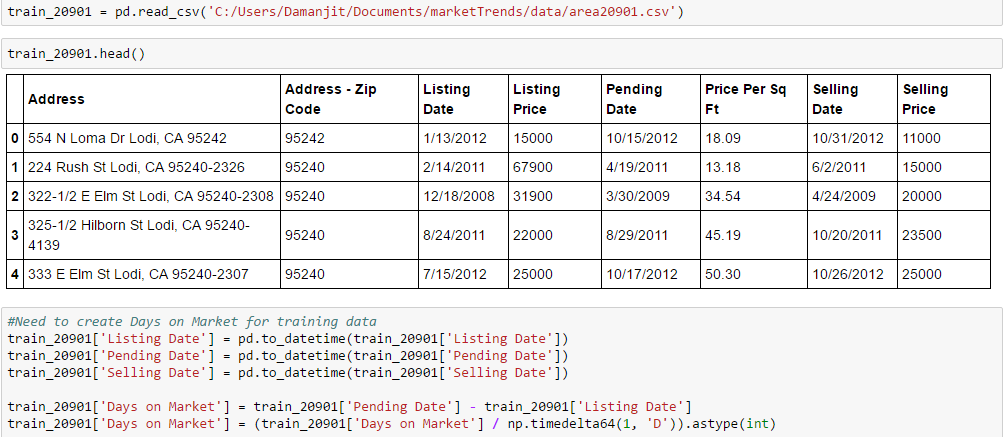
train_20901 = pd.read_csv('C:/Users/Damanjit/Documents/marketTrends/data/area20901.csv')
train_20901.head()
#small snippet of the full data, to see full data see images.
Address - Zip Code Listing Date Listing Price
0 95242 10/15/2012 15000
1 95240 2/14/2011 67900
2 95240 12/18/2008 31900
3 95240 8/24/2011 22000
4 95240 7/15/2012 25000
#Need to create Days on Market for training data
train_20901['Listing Date'] = pd.to_datetime(train_20901['Listing Date'])
train_20901['Pending Date'] = pd.to_datetime(train_20901['Pending Date'])
train_20901['Selling Date'] = pd.to_datetime(train_20901['Selling Date'])
train_20901['Days on Market'] = train_20901['Pending Date'] - train_20901['Listing Date']
train_20901['Days on Market'] = (train_20901['Days on Market'] / np.timedelta64(1, 'D')).astype(int)
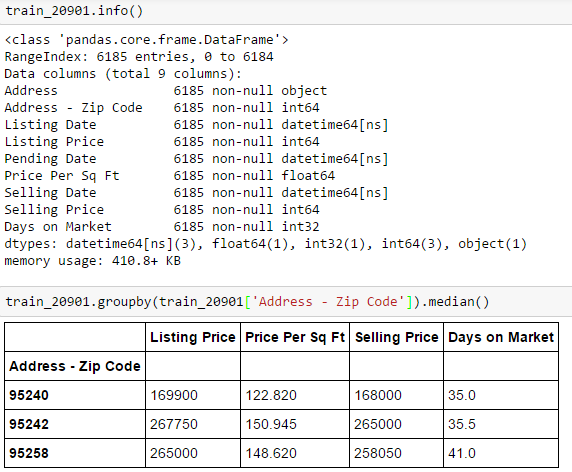
train_20901.info()
<class 'pandas.core.frame.DataFrame'>
RangeIndex: 6185 entries, 0 to 6184
Data columns (total 9 columns):
Address 6185 non-null object
Address - Zip Code 6185 non-null int64
Listing Date 6185 non-null datetime64[ns]
Listing Price 6185 non-null int64
Pending Date 6185 non-null datetime64[ns]
Price Per Sq Ft 6185 non-null float64
Selling Date 6185 non-null datetime64[ns]
Selling Price 6185 non-null int64
Days on Market 6185 non-null int32
dtypes: datetime64[ns](3), float64(1), int32(1), int64(3), object(1)
memory usage: 410.8+ KB
train_20901.groupby(train_20901['Address - Zip Code']).median()
Address - Zip Code Listing Price Price Per Sq Ft Selling Price Days on Market
95240 169900 122.820 168000 35.0
95242 267750 150.945 265000 35.5
95258 265000 148.620 258050 41.0打开数据并准备好
按邮编对数据进行分组
我想要做的是用上市日期来描绘上市价格的中位数随时间的变化。日期自2008年2月10日起至2016年9月12日结束。我想把日期存起来,这样只有日期和年份才能显示出来。例如,我想为95242、95240和95258的三个不同的邮政编码绘制12/09年的挂牌价格中位数。所以在12/09这段时间里,垃圾箱应该有三个不同的点。我想在10/08到12/16之间的所有不同时间周期中这样做。图中总共应该有99个回收箱。我所困惑的是如何在DataFrame中构造数据以完成这一任务并绘制它。我试过pandas.resample和pandas.pivot,但没有成功。任何正确方向的小提示都将不胜感激。
我想我的桌子最后看起来应该是这样的:
Listing Date    Zip Code     Median Home Prices
10/08           95240        168000
10/08           95242        216500
10/08           95258        210000
11/08           95240        171400
11/08           95242        219000
11/08           95258        212100
...and等,其中每个邮政编码都有自己的中间价格在一定时期内。我可以用字典对每个月和一年进行硬编码,这样就可以找到某个邮政编码的房价中值,但我觉得熊猫应该有一种更简单的方法来处理大型数据集。
编辑
------------------------------------------------------------------------------因此,当我使用重采样时,我确实为时间序列数据创建了回收箱,但是我希望单独获得不同的邮政编码。当我重新整理的时候我有这个
train_20901.resample('M', on = 'Selling Date').median()


Selling Date    Zip Code    Days on Market  Listing Price   Price Per Sq Ft Selling Price
2008-10-31        95240         21.0           160500         122.575        150000
2008-11-30        95240         36.0           179400         136.710        180000
2008-12-31        95240         32.0           165400         126.665        165025
2009-01-31        95240         37.5           165200         122.075        165000
2009-02-28        95240         52.0           174700         116.925        172500
2009-03-31        95240         48.5           129900         99.300         124950
2009-04-30        95240         35.5           164950         114.900        163250
2009-05-31        95240         21.0           159000         122.860        165000
2009-06-30        95240         36.0           134900         110.470        126000
2009-07-31        95240         14.0           174900         121.800        177500
我是否使用groupby函数,但如果使用,如何将索引保留为timeseries,但得到不同的邮政编码,而不是中间值?
解出
我通过这样做弄明白了。
resampled = train_20901.set_index('Selling Date').groupby('Address - Zip Code').resample('M').median()这正是我想要的,现在我只需要策划。
回答 1
Stack Overflow用户
发布于 2020-09-16 04:31:17
如上文所示,解决这一问题的办法是:
resampled = train_20901.set_index('Selling Date').groupby('Address - Zip Code').resample('M').median()https://stackoverflow.com/questions/41458698
复制相似问题
腾讯云开发者

Copyright © 2013 - 2026 Tencent Cloud. All Rights Reserved. 腾讯云 版权所有
深圳市腾讯计算机系统有限公司 ICP备案/许可证号:粤B2-20090059 ![]() 粤公网安备44030502008569号
粤公网安备44030502008569号
腾讯云计算(北京)有限责任公司 京ICP证150476号 | 京ICP备11018762号