
X轴上百分位标号的均匀分布
X轴上百分位标号的均匀分布
提问于 2016-12-28 17:48:37
请原谅我的术语,我不是统计学或绘图方面的专家!
使用Pandas,我试图绘制分位数数据,这些数据最多可达“59 s”。也就是说,对于具有一系列“foo”分布不均匀整数值的给定DataFrame 'df‘:
q = df['foo'].quantile([.1, .2, .3, .4, .5, .6, .7, .8, .9, .99, .999, .9999, .99999, 1])
q.plot()
结果显示,在0.9和1.0之间的x轴间隔被压缩:
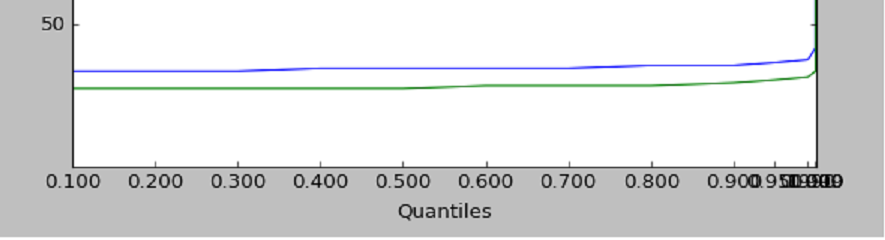
有没有办法将分位数桶均匀地空间在x轴上?
谢谢!
回答 2
Stack Overflow用户
回答已采纳
发布于 2017-01-06 13:54:37
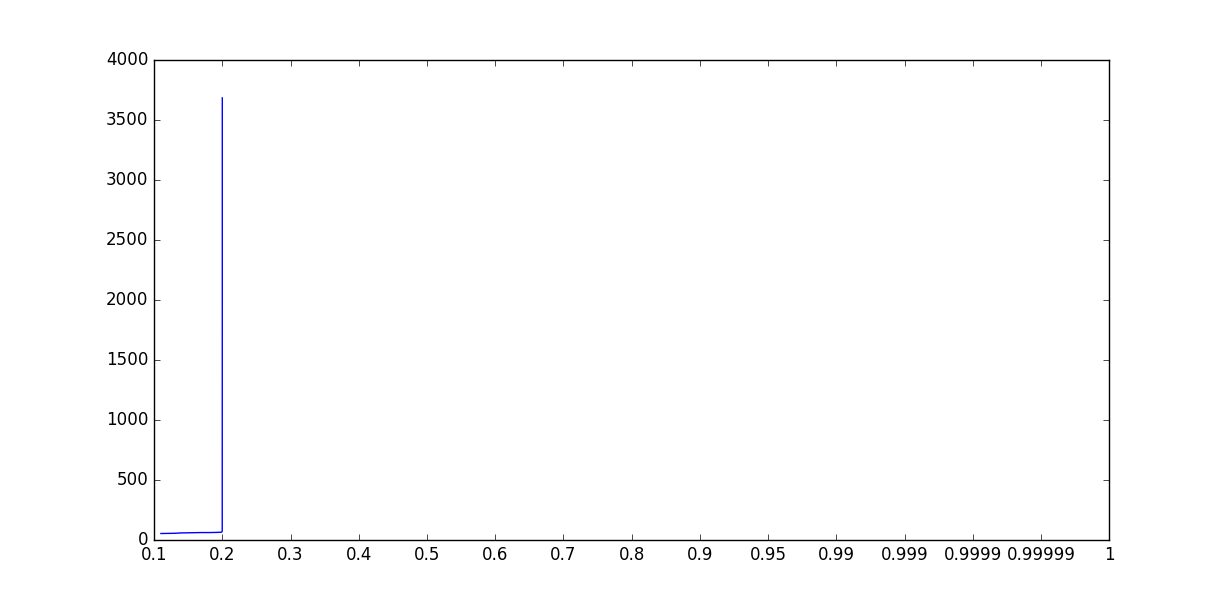
根据lmo的建议,以下是适合我的解决方案。
对于具有“A”系列的给定数据“df”:
percentiles = [.1, .2, .3, .4, .5, .6, .7, .8, .9, .99, .999, .9999, .99999, 1.0]

pct = df['A'].quantile(percentiles)
xticks = range(0, len(percentiles), 1)
ax = pct.plot (xticks=xticks)
ax.set_xticklabels([str(p) for p in percentiles)
plt.show()
Stack Overflow用户
发布于 2016-12-28 18:34:22
我会用pd.qcut
示例
import pandas as pd
import numpy as np

a = np.sort(np.random.rand(1000))
b = a.repeat(np.arange(len(a)))
b += np.random.rand(len(b)) / 100
s = pd.Series(b)

s.hist()
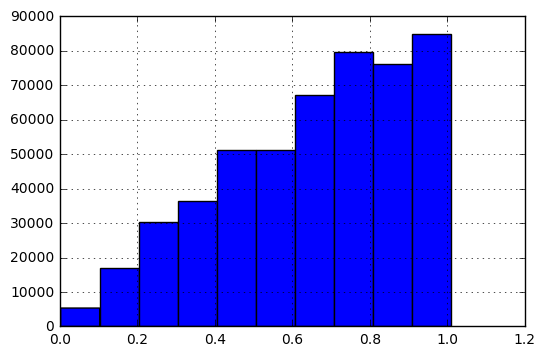
你想要这个
使用任何你想要的垃圾桶。我用了20,我还传递了一个标签参数。没有它,熊猫就会在剪裁的边缘贴上标签。
q = pd.qcut(s, 20, labels=range(20))页面原文内容由Stack Overflow提供。腾讯云小微IT领域专用引擎提供翻译支持
原文链接:
https://stackoverflow.com/questions/41367191
复制相关文章
相似问题
腾讯云开发者

Copyright © 2013 - 2026 Tencent Cloud. All Rights Reserved. 腾讯云 版权所有
深圳市腾讯计算机系统有限公司 ICP备案/许可证号:粤B2-20090059 ![]() 粤公网安备44030502008569号
粤公网安备44030502008569号
腾讯云计算(北京)有限责任公司 京ICP证150476号 | 京ICP备11018762号