
海图散点图
我试图在海运热图上标记一个位置(在本例中是颜色映射轴上的最小值)。但是我想要标记的位置介于热图上的值之间,因为它是离散的,并且以比原始数据分辨率更低的分辨率绘制。我有一种感觉,我只是需要使用相同的斧头,以正确地绘制,但我似乎找不到任何可行的!相反,我的散点点要么总是出现在左下角,要么根本不出现。
那么--我如何在这个低分辨率热图上绘制一个符号来表示我原来的、高分辨率的数据中的最小值呢?
这是我的密码:
import matplotlib.pyplot as plt
import seaborn as sns
import pandas as pd
import numpy as np
import math

number_of_planes = 100

cos_thetas = np.empty(number_of_planes)
phis = np.empty(number_of_planes)
for i in range(0,number_of_planes):
    phi = np.random.uniform(0,2*math.pi)
    theta = math.acos(2*np.random.uniform(0.5,1) - 1)

    phis[i] = phi
    cos_thetas[i] = math.cos(theta)

thicknesses = np.random.rand(number_of_planes, number_of_planes)

sns.set_style("darkgrid")
fig = plt.figure()
ax = fig.add_subplot(111, aspect='equal')

thick_df = pd.DataFrame(thicknesses*1000, columns=phis, index=cos_thetas)

#print thick_df

thick_df = thick_df.sort_index(axis=0, ascending=False)
thick_df = thick_df.sort_index(axis=1)

cmap = sns.cubehelix_palette(start=2.9, light=0.9, as_cmap=True, reverse=True)

yticks = np.linspace(0,1,6)

x_end = 6
xticks = np.arange(x_end+1)

m, n = 10, 10
row_groups = np.arange(len(thick_df.index)) // m
col_groups = np.arange(len(thick_df.columns)) // n

grpd = pd.DataFrame(thick_df.values, row_groups, col_groups)

val = pd.to_numeric(grpd.stack(), 'coerce').groupby(level=[0, 1]).mean().unstack().values
idx = thick_df.index.to_series().groupby(row_groups).mean().values
col = thick_df.columns.to_series().groupby(col_groups).mean().values

new_thick_df = pd.DataFrame(val, idx, col)

sns.heatmap(new_thick_df, linewidth=0, xticklabels=xticks, yticklabels=yticks[::-1], square=True, cmap=cmap, ax=ax)
#new_thick_df.plot.scatter(thick_df.columns.argmin(), thick_df.index.argmin(), ax=ax, c='r', s=100)
#One problem here is that thick_df.columns.argmin() gives an integer position instead of the column label
ax.scatter(thick_df.columns.argmin(), thick_df.index.argmin(), marker='*', s=100, color='yellow')

ax.set_xticks(xticks*ax.get_xlim()[1]/(2*math.pi))
ax.set_yticks(yticks*ax.get_ylim()[1])
ax.set_xlabel(r'$\rm{\phi}$', fontsize=16)
ax.set_ylabel(r'$\rm{\cos\ \theta}$', fontsize=16)
plt.figtext(0.865, 0.5, r'$\rm{thickness\ (kpc)}$', fontsize=15, rotation=270, horizontalalignment='left', verticalalignment='center')

plt.show()回答 1
Stack Overflow用户
发布于 2016-12-24 13:07:56
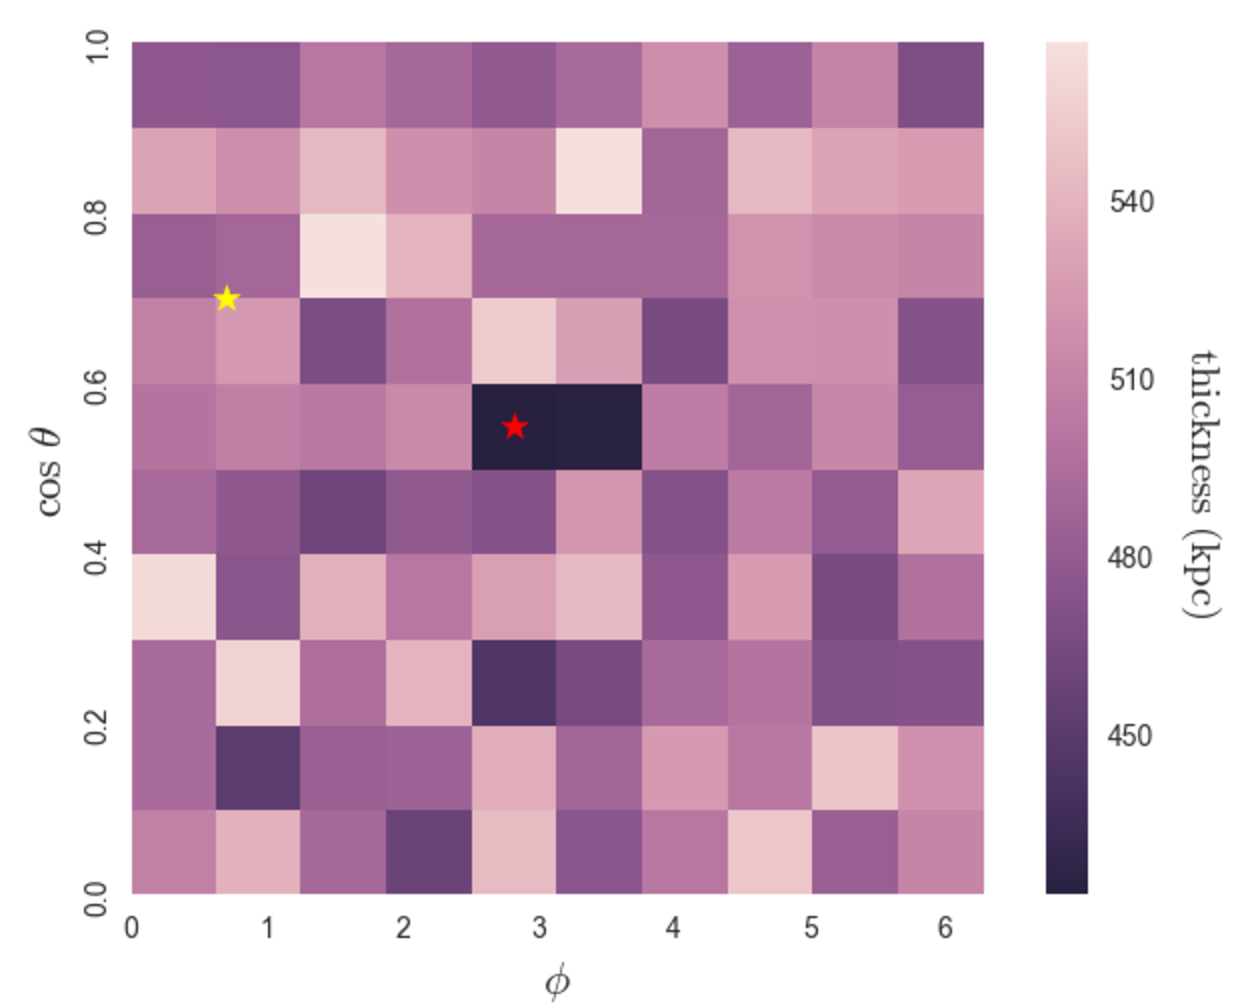
从注释中,您只想从thick_df的绝对值中绘制一颗星星。您已经将thick_df的每10x10段平均为一个new_thick_df。热图是从new_thick_df创建的,但您希望将thick_df中的最小值绘制到此热图上。你必须先找出最小值,把thick_df压平,然后缩小尺寸,以便将它们转换成0到10之间的范围。我还为new_thick_df绘制了一颗红星。
将该行:ax.scatter(thick_df.columns.argmin(), thick_df.index.argmin(), marker='*', s=100, color='yellow')更改为以下行
idx_min_big = thick_df.values.flatten().argmin()
x_min_big, y_min_big = (idx_min_big % 100) / 10 , 10 - (idx_min_big // 100) / 10
ax.scatter(x_min_big, y_min_big, marker='*', s=100, color='yellow')

# get min of new_thick_df
min_idx = new_thick_df.values.flatten().argmin()
x_min, y_min = min_idx % 10 + .5, 9 - min_idx // 10 + .5
ax.scatter(x_min, y_min, marker='*', s=100, color='yellow')
证明thick_df的最小值与这个逻辑一起工作
x,y = idx_min_big // 100, idx_min_big % 100
thick_df.iloc[x, y]
输出
0.075901121550980832得到最小值
thick_df.values.flatten().min()输出
0.075901121550980832https://stackoverflow.com/questions/41311302
复制相似问题
腾讯云开发者

Copyright © 2013 - 2026 Tencent Cloud. All Rights Reserved. 腾讯云 版权所有
深圳市腾讯计算机系统有限公司 ICP备案/许可证号:粤B2-20090059 ![]() 粤公网安备44030502008569号
粤公网安备44030502008569号
腾讯云计算(北京)有限责任公司 京ICP证150476号 | 京ICP备11018762号