
自定义ggcorr图
自定义ggcorr图
提问于 2016-12-21 18:31:26
我希望减少ggcorrplot中标记的大小,并减少文本和绘图之间的空间。
library(ggcorrplot)
data(mtcars)
corr <- round(cor(mtcars), 1)
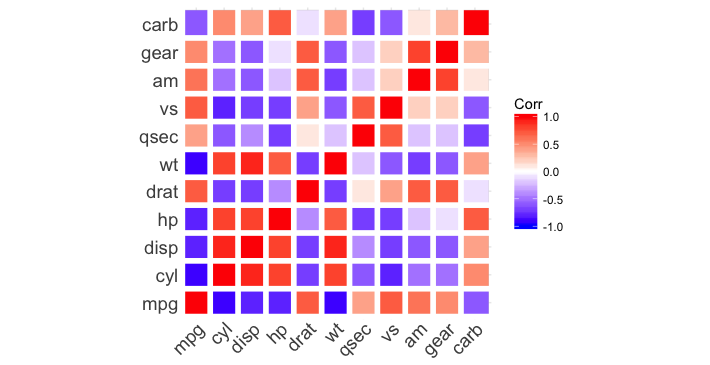
ggcorrplot(corr,sig.level=0.05 ,lab_size = 4.5, p.mat = NULL, insig = c("pch", "blank"), pch = 1, pch.col = "black", pch.cex =1,
tl.cex = 14)回答 1
Stack Overflow用户
回答已采纳
发布于 2016-12-21 19:00:59
您可以使用theme元素调整轴文本与绘图之间的距离。使用标准geom_tile中的ggplot,您可以调整瓷砖的height和width。ggcorrplot似乎不接受这种调整。也许有一种方式我不知道,我以前没有使用过这个包。我讨厌的解决方法就是覆盖一个白色的网格,以便在瓷砖之间创建空间:
ggcorrplot(corr, sig.level=0.05, lab_size = 4.5, p.mat = NULL,
           insig = c("pch", "blank"), pch = 1, pch.col = "black", pch.cex =1,
           tl.cex = 14) +
  theme(axis.text.x = element_text(margin=margin(-2,0,0,0)),  # Order: top, right, bottom, left
        axis.text.y = element_text(margin=margin(0,-2,0,0))) +
  geom_vline(xintercept=1:ncol(mtcars)-0.5, colour="white", size=2) +
  geom_hline(yintercept=1:ncol(mtcars)-0.5, colour="white", size=2)
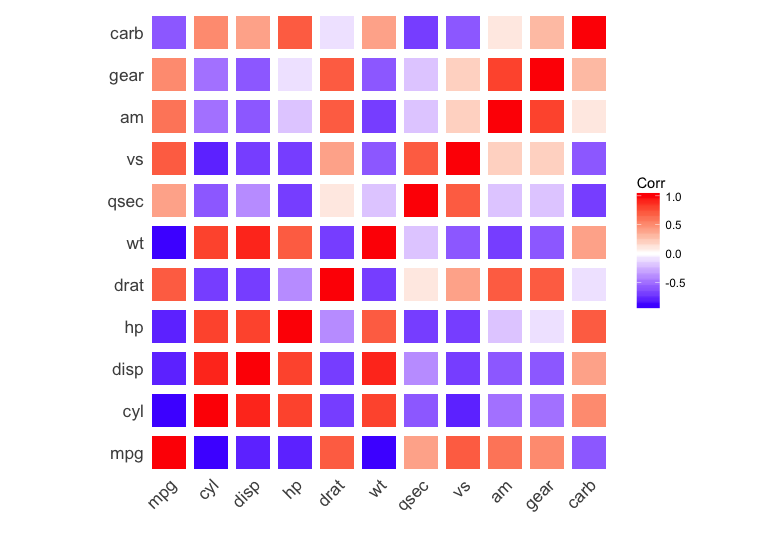
这种类型的绘图作为一个常规的ggplot也不是那么困难,然后您将完全控制绘图元素:
library(reshape2)

ggplot(melt(corr), aes(Var1, Var2, fill=value)) +
  geom_tile(height=0.8, width=0.8) +
  scale_fill_gradient2(low="blue", mid="white", high="red") +
  theme_minimal() +
  coord_equal() +
  labs(x="",y="",fill="Corr") +
  theme(axis.text.x=element_text(size=13, angle=45, vjust=1, hjust=1,
                                 margin=margin(-3,0,0,0)),
        axis.text.y=element_text(size=13, margin=margin(0,-3,0,0)),
        panel.grid.major=element_blank())
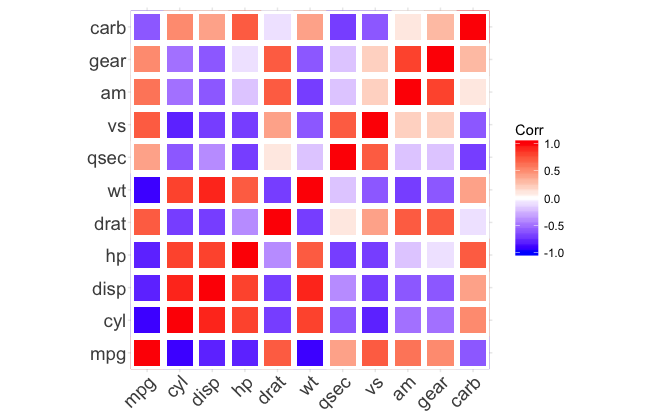
ggcorrplot的另一个黑客是掩盖并重新绘制使用geom_tile的瓷砖,这样我们就可以访问height和width参数:
ggcorrplot(corr, sig.level=0.05, lab_size = 4.5, p.mat = NULL,
           insig = c("pch", "blank"), pch = 1, pch.col = "black", pch.cex =1,
           tl.cex = 14) +
  theme(axis.text.x = element_text(margin=margin(-2,0,0,0)),
        axis.text.y = element_text(margin=margin(0,-2,0,0)),
        panel.grid.minor = element_line(size=10)) +
  geom_tile(fill="white") +
  geom_tile(height=0.8, width=0.8)
页面原文内容由Stack Overflow提供。腾讯云小微IT领域专用引擎提供翻译支持
原文链接:
https://stackoverflow.com/questions/41269593
复制相关文章
相似问题
腾讯云开发者

Copyright © 2013 - 2026 Tencent Cloud. All Rights Reserved. 腾讯云 版权所有
深圳市腾讯计算机系统有限公司 ICP备案/许可证号:粤B2-20090059 ![]() 粤公网安备44030502008569号
粤公网安备44030502008569号
腾讯云计算(北京)有限责任公司 京ICP证150476号 | 京ICP备11018762号