
python中线性模型的图对比
python中线性模型的图对比
提问于 2016-12-13 14:50:00
在python中,我试图绘制线性模型的效果。
data = pd.read_excel(input_filename)
data.sexe = data.sexe.map({1:'m', 2:'f'})
data.diag = data.diag.map({1:'asd', 4:'hc'})
data.site = data.site.map({ 10:'USS', 20:'UYU', 30:'CAM', 40:'MAM', 2:'Cre'})

lm_full = sm.formula.ols(formula= L_bankssts_thickavg ~  diag + age + sexe + site' % var, data=data).fit()
我使用了一个线性模型,它工作得很好:
print(lm_full.summary()) 给予:
                             OLS Regression Results
===============================================================================
Dep. Variable:     L_bankssts_thickavg   R-squared:                       0.156
Model:                             OLS   Adj. R-squared:                  0.131
Method:                  Least Squares   F-statistic:                     6.354
Date:                 Tue, 13 Dec 2016   Prob (F-statistic):           7.30e-07
Time:                         15:40:28   Log-Likelihood:                 98.227
No. Observations:                  249   AIC:                            -180.5
Df Residuals:                      241   BIC:                            -152.3
Df Model:                            7
Covariance Type:             nonrobust
===================================================================================
                      coef    std err          t      P>|t|      [95.0% Conf. Int.]
-----------------------------------------------------------------------------------
Intercept           2.8392      0.055     51.284      0.000         2.730     2.948
diag[T.hc]         -0.0567      0.021     -2.650      0.009        -0.099    -0.015
sexe[T.m]          -0.0435      0.029     -1.476      0.141        -0.102     0.015
site[T.Cre]        -0.0069      0.036     -0.189      0.850        -0.078     0.065
site[T.MAM]        -0.0635      0.040     -1.593      0.112        -0.142     0.015
site[T.UYU]        -0.0948      0.038     -2.497      0.013        -0.170    -0.020
site[T.USS]         0.0145      0.037      0.396      0.692        -0.058     0.086
age                -0.0059      0.001     -4.209      0.000        -0.009    -0.003
==============================================================================
Omnibus:                        0.698   Durbin-Watson:                   2.042
Prob(Omnibus):                  0.705   Jarque-Bera (JB):                0.432
Skew:                          -0.053   Prob(JB):                        0.806
Kurtosis:                       3.175   Cond. No.                         196.
==============================================================================
我知道想要绘制"diag“变量的效果:正如在我的模型中所显示的那样,诊断对因变量有影响,我想画出这个效果。我想要一个带有diag的两个可能值的图形表示(即:'asd‘和'hc'),以显示哪个组的值最低(即对比度的图形表示)。
我想要类似于R中的allEffect库的东西
你认为python中也有类似的功能吗?
回答 1
Stack Overflow用户
回答已采纳
发布于 2016-12-16 15:12:30
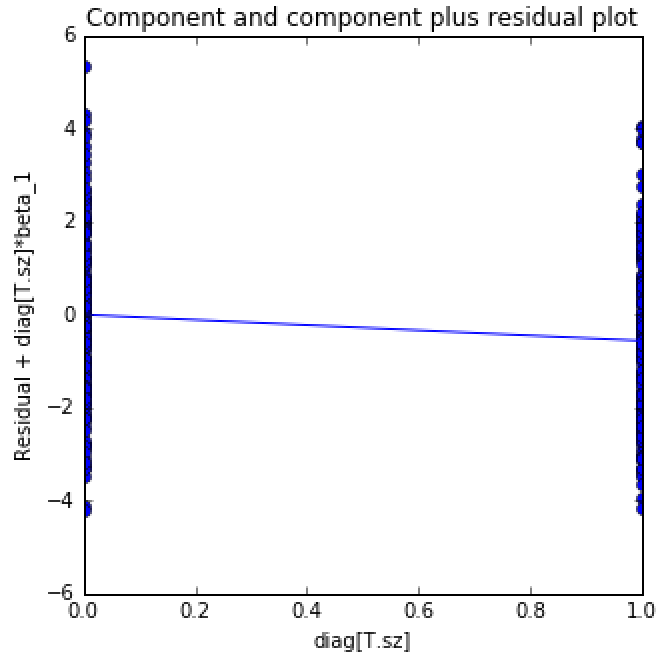
绘制此效果的最佳方法是使用matplot进行CCPR绘图。
# Component-Component plus Residual (CCPR) Plots (= partial residual plot)
fig, ax = plt.subplots(figsize=(5, 5))
fig = sm.graphics.plot_ccpr(lm_full, 'diag[T.sz]', ax=ax)
plt.close
这给
页面原文内容由Stack Overflow提供。腾讯云小微IT领域专用引擎提供翻译支持
原文链接:
https://stackoverflow.com/questions/41123980
复制相关文章
相似问题
腾讯云开发者

Copyright © 2013 - 2026 Tencent Cloud. All Rights Reserved. 腾讯云 版权所有
深圳市腾讯计算机系统有限公司 ICP备案/许可证号:粤B2-20090059 ![]() 粤公网安备44030502008569号
粤公网安备44030502008569号
腾讯云计算(北京)有限责任公司 京ICP证150476号 | 京ICP备11018762号