
如何在空闲网格jqgrid中对行进行分类?
嗨,我有下表来生成一个json数据集
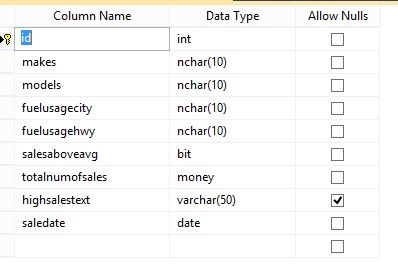
它有以下数据--我有脚本表
USE [GridSamples]
GO
/****** Object:  Table [dbo].[SalesStats]    Script Date: 12/13/2016 07:34:51 PM ******/
SET ANSI_NULLS ON
GO
SET QUOTED_IDENTIFIER ON
GO
SET ANSI_PADDING ON
GO
CREATE TABLE [dbo].[SalesStats](
    [id] [int] IDENTITY(1,1) NOT NULL,
    [makes] [nchar](10) NOT NULL,
    [models] [nchar](10) NOT NULL,
    [fuelusagecity] [nchar](10) NOT NULL,
    [fuelusagehwy] [nchar](10) NOT NULL,
    [salesaboveavg] [bit] NOT NULL,
    [totalnumofsales] [money] NOT NULL,
    [highsalestext] [varchar](50) NULL,
    [saledate] [date] NOT NULL,
 CONSTRAINT [PK_SalesStats] PRIMARY KEY CLUSTERED
(
    [id] ASC
)WITH (PAD_INDEX = OFF, STATISTICS_NORECOMPUTE = OFF, IGNORE_DUP_KEY = OFF, ALLOW_ROW_LOCKS = ON, ALLOW_PAGE_LOCKS = ON) ON [PRIMARY]
) ON [PRIMARY]

GO
SET ANSI_PADDING OFF
GO
SET IDENTITY_INSERT [dbo].[SalesStats] ON

GO
INSERT [dbo].[SalesStats] ([id], [makes], [models], [fuelusagecity], [fuelusagehwy], [salesaboveavg], [totalnumofsales], [highsalestext], [saledate]) VALUES (1, N'toyota    ', N'corolla   ', N'17        ', N'12        ', 0, 120000.0000, NULL, CAST(0x9A330B00 AS Date))
GO
INSERT [dbo].[SalesStats] ([id], [makes], [models], [fuelusagecity], [fuelusagehwy], [salesaboveavg], [totalnumofsales], [highsalestext], [saledate]) VALUES (2, N'toyota    ', N'corolla   ', N'10        ', N'14        ', 0, 100000.0000, N'HIGH', CAST(0xA8330B00 AS Date))
GO
INSERT [dbo].[SalesStats] ([id], [makes], [models], [fuelusagecity], [fuelusagehwy], [salesaboveavg], [totalnumofsales], [highsalestext], [saledate]) VALUES (3, N'toyota    ', N'belta     ', N'15        ', N'10        ', 1, 200000.0000, NULL, CAST(0xC2330B00 AS Date))
GO
INSERT [dbo].[SalesStats] ([id], [makes], [models], [fuelusagecity], [fuelusagehwy], [salesaboveavg], [totalnumofsales], [highsalestext], [saledate]) VALUES (4, N'toyota    ', N'camry     ', N'13        ', N'10        ', 0, 300000.0000, N'HIGH', CAST(0x29340B00 AS Date))
GO
INSERT [dbo].[SalesStats] ([id], [makes], [models], [fuelusagecity], [fuelusagehwy], [salesaboveavg], [totalnumofsales], [highsalestext], [saledate]) VALUES (5, N'nissan    ', N'skyline   ', N'14        ', N'9         ', 1, 500000.0000, N'HIGH', CAST(0x48330B00 AS Date))
GO
INSERT [dbo].[SalesStats] ([id], [makes], [models], [fuelusagecity], [fuelusagehwy], [salesaboveavg], [totalnumofsales], [highsalestext], [saledate]) VALUES (6, N'nissan    ', N'zx300     ', N'10        ', N'8         ', 0, 400000.0000, NULL, CAST(0x2B350B00 AS Date))
GO
SET IDENTITY_INSERT [dbo].[SalesStats] OFF
GO
在我的中间层ASP.MVC中,控制器将其转换为以下json (UPADATED为具有字符串SalesDate)
var data = [{"id":1,"make":"toyota","model":"corolla","fuelusagecity":"17","fuelusagehwy":"12","salesaboveavg":false,"totalnumberofsales":120000.0000,"highsalestext":null,"salesdate":"2010-12-01"},{"id":2,"make":"toyota","model":"corolla","fuelusagecity":"10","fuelusagehwy":"14","salesaboveavg":false,"totalnumberofsales":100000.0000,"highsalestext":"HIGH","salesdate":"2010-12-15"},{"id":3,"make":"toyota","model":"belta","fuelusagecity":"15","fuelusagehwy":"10","salesaboveavg":true,"totalnumberofsales":200000.0000,"highsalestext":null,"salesdate":"2011-01-10"},{"id":4,"make":"toyota","model":"camry","fuelusagecity":"13","fuelusagehwy":"10","salesaboveavg":false,"totalnumberofsales":300000.0000,"highsalestext":"HIGH","salesdate":"2011-04-23"},{"id":5,"make":"nissan","model":"skyline","fuelusagecity":"14","fuelusagehwy":"9","salesaboveavg":true,"totalnumberofsales":500000.0000,"highsalestext":"HIGH","salesdate":"2010-09-10"},{"id":6,"make":"nissan","model":"zx300","fuelusagecity":"10","fuelusagehwy":"8","salesaboveavg":false,"totalnumberofsales":400000.0000,"highsalestext":null,"salesdate":"2012-01-06"}];我使用了以下代码来使用JqGrid空闲网格生成网格。为了方便起见,我将上面的json数组添加到data数组中。
<!DOCTYPE html>
<html>
<head lang="en">
<meta charset="UTF-8">
<title></title>
<link rel="stylesheet" href="http://code.jquery.com/ui/1.12.1/themes/south-street/jquery-ui.css" />
<link rel="stylesheet" href="https://cdn.jsdelivr.net/free-jqgrid/4.13.5/css/ui.jqgrid.min.css" />
</head>
<body>
<table id="list483"></table>
<div id=""></div>
<!--<script type="text/javascript" src="https://cdnjs.cloudflare.com/ajax/libs/jquery/1.12.3/jquery.min.js"></script>-->
<script src="https://cdnjs.cloudflare.com/ajax/libs/jquery/3.1.1/jquery.min.js"></script>
<!--<script src="https://cdn.jsdelivr.net/free-jqgrid/4.13.5/js/i18n/grid.locale-de.min.js"></script>-->
<script src="https://cdn.jsdelivr.net/free-jqgrid/4.13.5/js/jquery.jqgrid.min.js"></script>
<script>
var data = [{"id":1,"make":"toyota","model":"corolla","fuelusagecity":"17","fuelusagehwy":"12","salesaboveavg":false,"totalnumberofsales":120000.0000,"highsalestext":null,"salesdate":"2010-12-01"},{"id":2,"make":"toyota","model":"corolla","fuelusagecity":"10","fuelusagehwy":"14","salesaboveavg":false,"totalnumberofsales":100000.0000,"highsalestext":"HIGH","salesdate":"2010-12-15"},{"id":3,"make":"toyota","model":"belta","fuelusagecity":"15","fuelusagehwy":"10","salesaboveavg":true,"totalnumberofsales":200000.0000,"highsalestext":null,"salesdate":"2011-01-10"},{"id":4,"make":"toyota","model":"camry","fuelusagecity":"13","fuelusagehwy":"10","salesaboveavg":false,"totalnumberofsales":300000.0000,"highsalestext":"HIGH","salesdate":"2011-04-23"},{"id":5,"make":"nissan","model":"skyline","fuelusagecity":"14","fuelusagehwy":"9","salesaboveavg":true,"totalnumberofsales":500000.0000,"highsalestext":"HIGH","salesdate":"2010-09-10"},{"id":6,"make":"nissan","model":"zx300","fuelusagecity":"10","fuelusagehwy":"8","salesaboveavg":false,"totalnumberofsales":400000.0000,"highsalestext":null,"salesdate":"2012-01-06"}];
$("#list483").jqGrid("jqPivot",
data,
{
frozenStaticCols: true,
xDimension: [
{/*x0*/ dataName: "make", width: 200, label: "Make" },
{/*x1*/ dataName: "model", skipGrouping: true },
{/*x2*/ dataName: "fuelusagecity", hidden: true, skipGrouping: true },
{/*x3*/ dataName: "fuelusagehwy", width: 80, align: "center",
label: "fuel consumption", skipGrouping: true,
formatter: function (cellvalue, options, rowObject) {
return rowObject.x2 === null || rowObject.x3 === null ?
"-" :
String(rowObject.x2) + "-" + String(cellvalue);
}
},
{/*x4*/ dataName: "salesaboveavg", hidden: true, width: 50, align: "center", skipGrouping: true },
{/*x5*/ dataName: "highsalestext", hidden: true, skipGrouping: true }
],
yDimension: [
{/*y0*/ dataName: "salesdate",
sorttype: "date",
formatter: function (cellvalue, options, rowObject) {
//var x = rawObject.y0;
console.log(rowObject);
// return rowObject;
}
}],
aggregates: [{
member: "totalnumberofsales",
aggregator: "max"
}]
},
// grid options
{
iconSet: "fontAwesome",
cmTemplate: { autoResizable: true, width: 90 },
shrinkToFit: false,
useUnformattedDataForCellAttr: false,
autoResizing: { compact: true },
groupingView: {
groupField: ["x0"],
groupColumnShow: [false],
groupText: ['<b>{0}</b>']
},
width: 450,
pager: true,
rowNum: 20,
rowList: [5, 10, 20, 100, "10000:All"],
caption: "<b>Car sales statistics</b>"
}
);
</script>
</body>
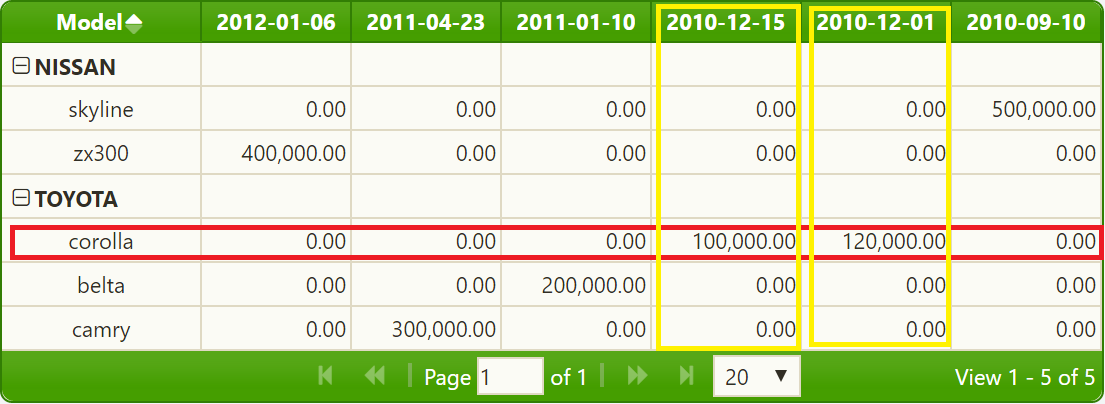
</html>生成的网格显示在图像链接下面。
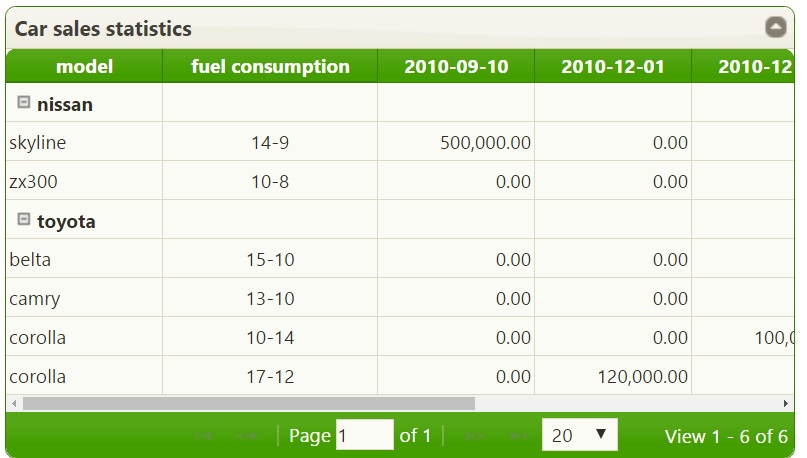
我有很多关于这个网格的问题。但随着回答的进展,我会一个一个地发出来。但就目前而言,首先要提出的问题如下:
- 当我打开组分组时,应该出现在组名后面的折叠图标图像发生了什么?解决了:我找到了这个问题的答案,丢失的字体-可怕的库导致了问题。
- 如何在teh dates列中转换json日期并以实际日期显示它们?解决了:一旦在中间层进行转换以返回saledate字符串值,这个问题就解决了。
- 网格在丰田花冠上有两个条目,但是这应该是一个条目,在这个条目中,
totalnumofsales值应该放在两个匹配日期上。在单行输入到丰田花冠,120000在2010-12-01cell,100000在2010-12-15,并且燃料假设值必须是第一行值,即10-14。 - 对于没有值的单元格显示0.00,而不是显示0.00,我需要它们来显示空单元格。
- 如何关闭网格的自动排序,因为当生成网格时,组名称按字母顺序排序,但我不使用网格对它们进行排序,而是保留它们来自后端的原始顺序。
我怎样才能做到这一点呢?
回答 1
Stack Overflow用户
发布于 2016-12-25 22:20:56
我认为你的问题的根源是一些常见的误解,什么是枢轴表以及如何使用它。我试着在一个输入数据的例子中详细解释下面的所有内容。
使用以下输入数据:
[{
    "id": 1,
    "make": "toyota",
    "model": "corolla",
    "fuelusagecity": "17",
    "fuelusagehwy": "12",
    "salesaboveavg": false,
    "totalnumberofsales": 120000.0000,
    "highsalestext": null,
    "salesdate": "2010-12-01"
}, {
    "id": 2,
    "make": "toyota",
    "model": "corolla",
    "fuelusagecity": "10",
    "fuelusagehwy": "14",
    "salesaboveavg": false,
    "totalnumberofsales": 100000.0000,
    "highsalestext": "HIGH",
    "salesdate": "2010-12-15"
}, {
    "id": 3,
    "make": "toyota",
    "model": "belta",
    "fuelusagecity": "15",
    "fuelusagehwy": "10",
    "salesaboveavg": true,
    "totalnumberofsales": 200000.0000,
    "highsalestext": null,
    "salesdate": "2011-01-10"
}, {
    "id": 4,
    "make": "toyota",
    "model": "camry",
    "fuelusagecity": "13",
    "fuelusagehwy": "10",
    "salesaboveavg": false,
    "totalnumberofsales": 300000.0000,
    "highsalestext": "HIGH",
    "salesdate": "2011-04-23"
}, {
    "id": 5,
    "make": "nissan",
    "model": "skyline",
    "fuelusagecity": "14",
    "fuelusagehwy": "9",
    "salesaboveavg": true,
    "totalnumberofsales": 500000.0000,
    "highsalestext": "HIGH",
    "salesdate": "2010-09-10"
}, {
    "id": 6,
    "make": "nissan",
    "model": "zx300",
    "fuelusagecity": "10",
    "fuelusagehwy": "8",
    "salesaboveavg": false,
    "totalnumberofsales": 400000.0000,
    "highsalestext": null,
    "salesdate": "2012-01-06"
}]每一项数据都有许多属性。有些属性包含不同的(甚至是唯一的)值(如id)。其他属性应该组合在一起,并在组中的每个项上的另一个属性上计算一些聚合函数。我在一个例子中解释了上面的陈述。
输入的数据包含了一些车型的销售信息。例如,显示每种车型按日期或年份等的销售量可能会很有趣。
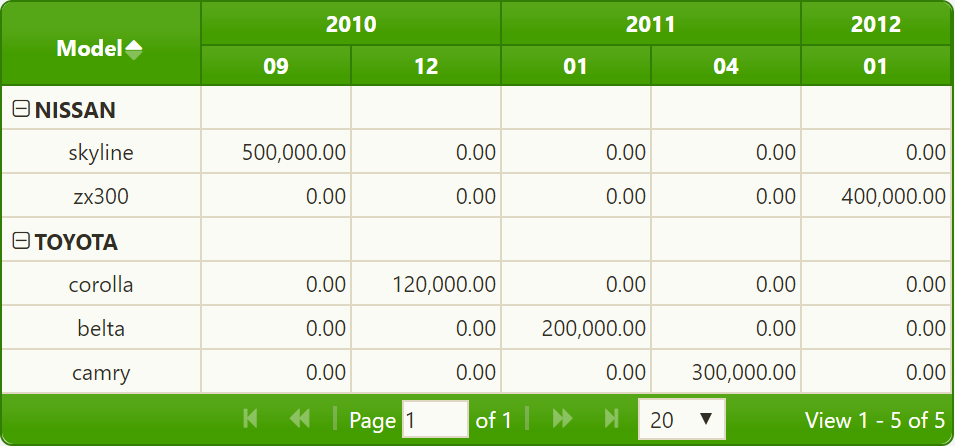
枢轴表包含三个主要参数xDimension、yDimension和aggregates。例如,请看下面的图片
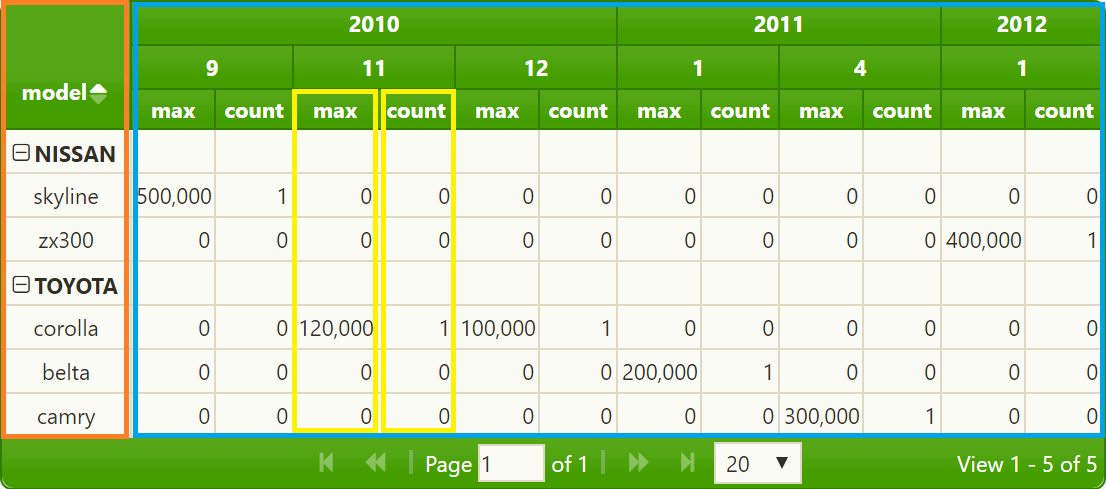
左边部分(橙色标记)表示xDimension (make和model)。它构建的主要是网格的行。右边的部分(蓝色标记)表示yDimension (输入项的year和month )。关于适当大小的信息的最低级别包含在某些输入属性上计算聚合函数(max和count)的结果(在示例中是totalnumberofsales )。
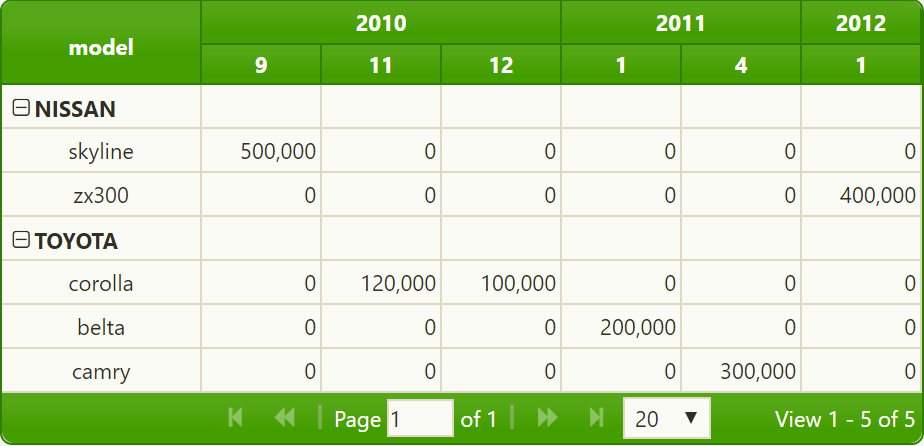
如果在aggregates参数中只定义了一个聚合函数,则不会显示聚合函数的名称:
现在,我必须显示jqPivot为创建jqGrid所做的工作。首先,它通过所有X和Y参数扫描所有输入数据。例如,如果您定义了以下枢轴模型
xDimension: [
    { dataName: "make", width: 100, label: "Make" },
    { dataName: "model", width: 100, label: "Model", align: "center" }
],
yDimension: [
    { dataName: "salesdate", sortorder: "desc" }
],
aggregates: [
    { member: "totalnumberofsales", aggregator: "max" }
]然后,首先扫描所有数据,以查找具有相同["make", "model"]值的xDimension项和yDimension中的["salesdate"]项。输入数据有6个元素,索引从0到5。结果的xIndexes和yIndexes包含以x和y为单位的唯一值,以及源数据(从0到5)到具有数据的项的索引。可以在jqPivot调用后添加以下行以查看索引:
var p = $("#list483").jqGrid("getGridParam");
console.log(JSON.stringify(p.pivotOptions.xIndex));
console.log(JSON.stringify(p.pivotOptions.yIndex));作为结果,我们将看到演示https://jsfiddle.net/oadzsnov/。我在下面包含了生成的xIndex和yIndex。xIndex是
{
    "items": [
        ["toyota", "corolla"],
        ["toyota", "belta"],
        ["toyota", "camry"],
        ["nissan", "skyline"],
        ["nissan", "zx300"]
    ],
    "indexesOfSourceData": [
        [0, 1],
        [2],
        [3],
        [4],
        [5]
    ],
    "trimByCollect": true,
    "caseSensitive": false,
    "skipSort": true,
    "fieldLength": 2,
    "fieldNames": ["make", "model"],
    "fieldSortDirection": [1, 1],
    "fieldCompare": [null, null]
}
yIndex是
{
    "items": [
        ["2012-01-06"],
        ["2011-04-23"],
        ["2011-01-10"],
        ["2010-12-15"],
        ["2010-12-01"],
        ["2010-09-10"]
    ],
    "indexesOfSourceData": [
        [5],
        [3],
        [2],
        [1],
        [0],
        [4]
    ],
    "trimByCollect": true,
    "caseSensitive": false,
    "skipSort": false,
    "fieldLength": 1,
    "fieldNames": ["salesdate"],
    "fieldSortDirection": [-1],
    "fieldCompare": [null]
}xIndex.items构建结果数据透视表的行,yIndex构建列。您可以看到行将是
["toyota", "corolla"],
["toyota", "belta"],
["toyota", "camry"],
["nissan", "skyline"],
["nissan", "zx300"]
各栏:
["2012-01-06"],
["2011-04-23"],
["2011-01-10"],
["2010-12-15"],
["2010-12-01"],
["2010-09-10"]此外,还可以看到源数据的两个元素(参见xIndex.indexesOfSourceData,即[0, 1]) xIndex.items对应于相同的x向量["toyota", "corolla"]。pivot表的内容(参见第一张图片上的黄色标记数据)将是执行指定的聚合函数的结果。我们用了
aggregates: [
    { member: "totalnumberofsales", aggregator: "max" }
]
索引0和1的源元素是
[{
    ...
    "make": "toyota",
    "model": "corolla",
    ...
    "totalnumberofsales": 120000.0000,
    ...
    "salesdate": "2010-12-01"
}, {
    ...
    "make": "toyota",
    "model": "corolla",
    ...
    "totalnumberofsales": 100000.0000,
    ...
    "salesdate": "2010-12-15"
}这些项目有不同的y向量(第一项为"salesdate": "2010-12-01",第二项为"salesdate": "2010-12-15" )。因此,聚合的计算将非常简单:120000列是"2010-12-01",100000列是"2010-12-15",0是所有其他日期,因为当天没有["toyota", "corolla"]销售:
如果要根据salesYear分配单独的salesdate和salesMonth属性,则可以使用
xDimension: [
    { dataName: "make", width: 100, label: "Make" },
    { dataName: "model", width: 100, label: "Model", align: "center" }
],
yDimension: [
    { dataName: "salesYear", sorttype: "integer" },
    { dataName: "salesMonth", sorttype: "integer" }
],
aggregates: [{
    member: "totalnumberofsales",
    aggregator: "max"
}]若要创建枢轴表,请执行以下操作。两个第一个源项都具有相同的salesdate ("2010-12-15"和"2010-12-15")。对这两个项目的max聚合器的计算得到了120000,将在生成的网格中看到这一点。
请参阅https://jsfiddle.net/fa40onkz/
如果你能跟着我,直到那个地方,那么你就可以理解任何从效果,你可以看到在结果的枢轴表。
例如,使用
{/*x2*/ dataName: "fuelusagecity", hidden: true, skipGrouping: true },
{/*x3*/ dataName: "fuelusagehwy", width: 80, align: "center",
    label: "fuel consumption", skipGrouping: true,
    formatter: function (cellvalue, options, rowObject) {
        return rowObject.x2 === null || rowObject.x3 === null ?
                "-" :
        String(rowObject.x2) + "-" + String(cellvalue);
    }
},
{/*x4*/ dataName: "salesaboveavg", hidden: true, width: 50, align: "center", skipGrouping: true },
{/*x5*/ dataName: "highsalestext", hidden: true, skipGrouping: true }在jqPivot选项中,因为两个["toyota", "corolla"]源项具有不同的 fuelusagecity、fuelusagehwy和highsalestext值。salesaboveavg值是相同的,但我认为salesaboveavg的使用是相同的错误。您应该从xDimension**.** 中删除这些项
若要在具有0值的单元格中显示空单元格,可以定义列模板
var myIntTemplate = {
    formatter: "currency",
    align: "right", sorttype: "number",
    searchoptions: { sopt: ["eq", "ne", "lt", "le", "gt", "ge"] },
formatoptions: { defaultValue: ""}};并在aggregates中使用
aggregates: [{
    member: "cellvalue",
    template: myIntTemplate,
    aggregator: "max"
}]
你会得到这样的结果
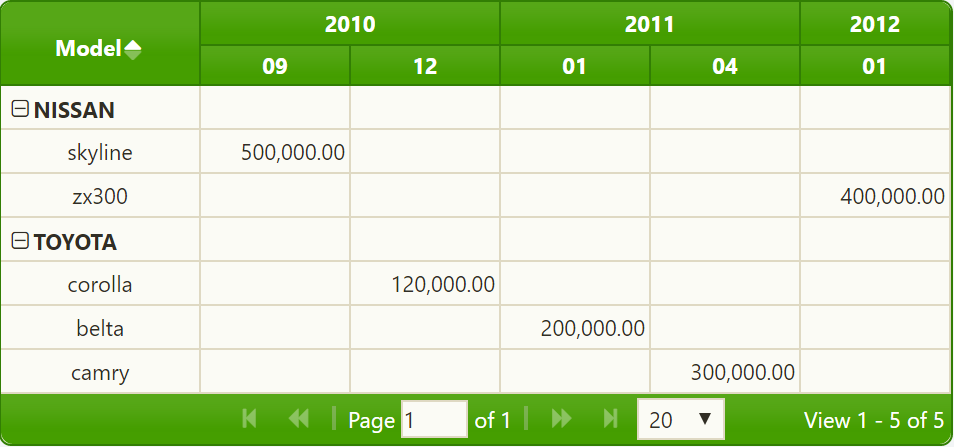
就像在演示https://jsfiddle.net/tnr2dgkv/上
你的最后一个问题是关于分类。对源项进行排序对于创建正确的枢轴表非常重要。您可以使用skipSortByX: true或/和jqPivot的skipSortByY: true选项来抑制初始数据的排序,但是如果使用分组(groupField: ["x0"]),则会再次对结果数据进行排序。我认为保持结果项顺序的最简单方法(但在实现中仍然不那么简单)是为xDimension项定义自定义排序函数。我建议您阅读维基文章以获得更多信息。
https://stackoverflow.com/questions/41123503
复制相似问题
腾讯云开发者

Copyright © 2013 - 2026 Tencent Cloud. All Rights Reserved. 腾讯云 版权所有
深圳市腾讯计算机系统有限公司 ICP备案/许可证号:粤B2-20090059 ![]() 粤公网安备44030502008569号
粤公网安备44030502008569号
腾讯云计算(北京)有限责任公司 京ICP证150476号 | 京ICP备11018762号