
NA不显示在ggplot2散射图中使用q图
NA不显示在ggplot2散射图中使用q图
提问于 2016-12-06 07:09:32
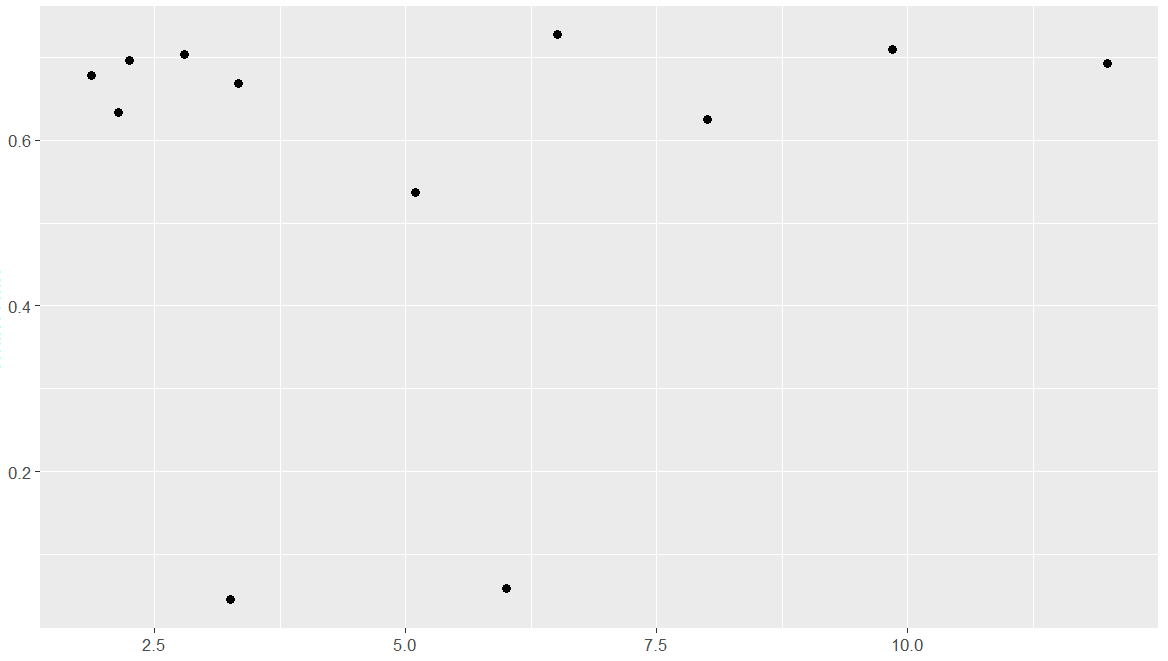
我正在使用qplot从ggplot2制作一个散点图。我不能看到x轴中的所有值.此外,它正在从x轴中移除NA。如何保留NA并控制x轴中显示的功能数量?
rate_plot = qplot(Result$temp, Result$CR, main="Rate", xlab=feature, ylab="Rate", size=I(3))+
  scale_x_discrete(drop=FALSE)
数据: Google链接
Result <- read.table(text = "   temp    NCH type    CH  i.type  CR
1   NA  1878464 nochurn 549371  churn   0.226280204
2   1.87    2236    nochurn 4713    churn   0.678227083
3   2.14    4945    nochurn 8530    churn   0.633024119
4   2.25    423 nochurn 972 churn   0.696774194
5   2.79    3238    nochurn 7692    churn   0.703751144
6   3.25    266817  nochurn 12678   churn   0.045360382
7   3.33    2132    nochurn 4295    churn   0.668274467
8   5.1 6683    nochurn 7743    churn   0.536739221
9   6   342554  nochurn 21648   churn   0.059439542
10  6.51    1785    nochurn 4764    churn   0.727439304
11  8   13668   nochurn 22751   churn   0.624701392
12  9.85    6005    nochurn 14687   churn   0.709791224
13 11.99 378 nochurn 850 churn 0.69218241", header = TRUE)回答 1
Stack Overflow用户
回答已采纳
发布于 2016-12-06 07:52:06
对于定制的滴答和标签,我们可以使用连续式。
下面的警告意味着从绘图数据中删除具有NA值的行:
删除了包含缺失值的1行(geom_point)
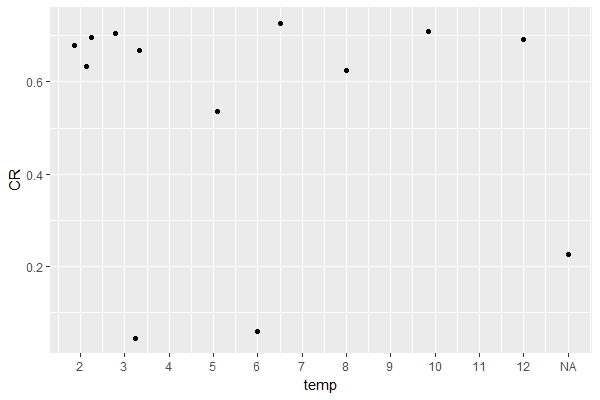
解决办法使NA出现在x轴上,我们需要为NA值分配一些值,这里我正在绘制图的右端NA值。获取x轴的最大值(temp变量),然后使用自定义x轴标签。
library(ggplot2)

# set NA to max value + 1
plotDat <- Result
plotDat[ is.na(plotDat$temp), "temp"] <- max(ceiling(plotDat$temp), na.rm = TRUE) + 1

#plot with custom breaks and labels
ggplot(plotDat, aes(x = temp, y = CR)) +
  geom_point() +
  scale_x_continuous(breaks = 1:max(ceiling(plotDat$temp)),
                     labels = c(1:(max(ceiling(plotDat$temp)) - 1), "NA"))
页面原文内容由Stack Overflow提供。腾讯云小微IT领域专用引擎提供翻译支持
原文链接:
https://stackoverflow.com/questions/40989701
复制相关文章
相似问题
腾讯云开发者

Copyright © 2013 - 2026 Tencent Cloud. All Rights Reserved. 腾讯云 版权所有
深圳市腾讯计算机系统有限公司 ICP备案/许可证号:粤B2-20090059 ![]() 粤公网安备44030502008569号
粤公网安备44030502008569号
腾讯云计算(北京)有限责任公司 京ICP证150476号 | 京ICP备11018762号