
使用ggtern的三角图
使用ggtern的三角图
提问于 2016-11-30 17:03:19
我试图用三角图中的一些区域来绘制一些点--这个代码:
library(ggtern)
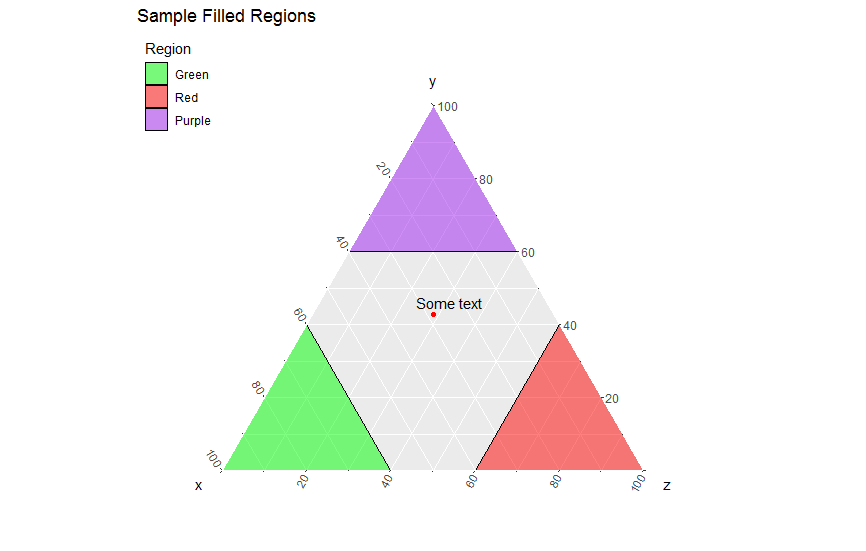
g <- data.frame(x=c(1,.6,.6), y=c(0,.4,0), z=c(0,0,.4), Series="Green")
r <- data.frame(x=c(0,0.4,0), y=c(0,0,0.4), z=c(1,0.6,0.6), Series="Red")
p <- data.frame(x=c(0,0.4,0), y=c(1,0.6,0.6), z=c(0,0,0.4), Series="Purple")
DATA = rbind(g,r,p)
plot <- ggtern(data=DATA,aes(x,y,z)) +
geom_polygon(aes(fill=Series),alpha=.5,color="black",size=0.25) +
scale_fill_manual(values=as.character(unique(DATA$Series))) +
theme(legend.position=c(0,1),legend.justification=c(0,1)) +
labs(fill="Region",title="Sample Filled Regions")
print(plot)我想在这个图中添加一些点,这些点是从文本文件中提取的,我正在读取它们的x、y和z坐标。我怎么能把这些指向阴谋呢?
如果我尝试这样的方法,它就会删除前面的情节:
plot <- ggtern(data = data.frame(x = cordnate_x, y = cordnate_y, z = cordnate_z),aes(x, y, z)) + geom_point() +theme_rgbg()
print(plot)
这就是我需要加分的情节。
回答 1
Stack Overflow用户
回答已采纳
发布于 2016-11-30 18:21:35
您可以添加点,就好像您有普通的ggplot对象一样。
g <- data.frame(x=c(1,.6,.6), y=c(0,.4,0), z=c(0,0,.4), Series="Green")
r <- data.frame(x=c(0,0.4,0), y=c(0,0,0.4), z=c(1,0.6,0.6), Series="Red")
p <- data.frame(x=c(0,0.4,0), y=c(1,0.6,0.6), z=c(0,0,0.4), Series="Purple")
DATA = rbind(g,r,p)

temp <- data.frame(x=c(0.4), y=c(0.6), z=c(0.4))
plot<- ggtern(data=DATA,aes(x,y,z)) +
    geom_polygon(aes(fill=Series),alpha=.5,color="black",size=0.25) +
    scale_fill_manual(values=as.character(unique(DATA$Series))) +
    theme(legend.position=c(0,1),legend.justification=c(0,1)) +
    labs(fill="Region",title="Sample Filled Regions") +
    geom_point(data = temp, colour = "red") +
    annotate("text", x = 0.3, y = 0.6, z = 0.4, label = "Some text")
页面原文内容由Stack Overflow提供。腾讯云小微IT领域专用引擎提供翻译支持
原文链接:
https://stackoverflow.com/questions/40894118
复制相关文章
相似问题
腾讯云开发者

Copyright © 2013 - 2026 Tencent Cloud. All Rights Reserved. 腾讯云 版权所有
深圳市腾讯计算机系统有限公司 ICP备案/许可证号:粤B2-20090059 ![]() 粤公网安备44030502008569号
粤公网安备44030502008569号
腾讯云计算(北京)有限责任公司 京ICP证150476号 | 京ICP备11018762号