
使用matplotlib设置数字的个性化彩色地图绘图
我有一个看上去像(例如)的数据
x y d
0 0 -2
1 0 0
0 1 1
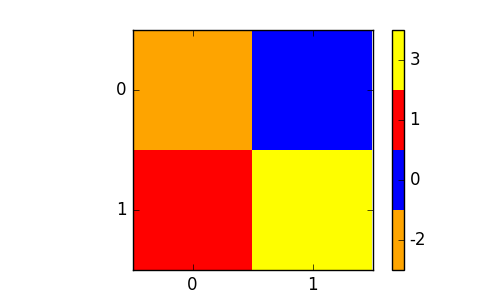
1 1 3我想把这个变成彩色地图,看上去像这样:

其中x和y在表中,颜色由'd‘表示。但是,我希望每个数字都有一个预先确定的颜色,例如:
-2 - orange
 0 - blue
 1 - red
 3 - yellow
不一定是这些颜色,但我需要说明一个数字到一个颜色,数字没有顺序或顺序,只是一组五六个随机数,它们在整个数组中重复。
任何想法,我都没有密码,因为我不知道从哪里开始。不过,我看过这里的例子,例如:
Matplotlib python change single color in colormap
然而,它们只说明如何定义颜色,而不是如何将这些颜色与特定的值联系起来。
回答 1
Stack Overflow用户
发布于 2016-12-01 09:09:56
事实证明,这比我想象的要难,所以也许有人有更简单的方法来做这件事。
因为我们需要创建数据的图像,所以我们将它们存储在一个2D数组中。然后,我们可以将数据映射到整数0 .. number of different data values,并为每个整数指定一个颜色。原因是我们希望最终的颜色图是等距的。所以
值-2 ->整数0 -->彩色orange
值0 ->整数1 -->颜色blue等等。
有了很好的整数间距,我们可以在新创建的整数值的图像上使用ListedColormap。
import matplotlib.pyplot as plt
import numpy as np
import matplotlib.colors

# define the image as a 2D array
d = np.array([[-2,0],[1,3]])

# create a sorted list of all unique values from d
ticks = np.unique(d.flatten()).tolist()
# create a new array of same shape as d
# we will later use this to store values from 0 to number of unique values
dc = np.zeros(d.shape)
#fill the array dc
for i in range(d.shape[0]):
    for j in range(d.shape[1]):
        dc[i,j] = ticks.index(d[i,j])

# now we need n (= number of unique values) different colors
colors= ["orange", "blue", "red", "yellow"]
# and put them to a listed colormap
colormap =  matplotlib.colors.ListedColormap(colors)


plt.figure(figsize=(5,3))
#plot the newly created array, shift the colorlimits,
# such that later the ticks are in the middle
im = plt.imshow(dc, cmap=colormap, interpolation="none", vmin=-0.5, vmax=len(colors)-0.5)
# create a colorbar with n different ticks
cbar = plt.colorbar(im, ticks=range(len(colors)) )
#set the ticklabels to the unique values from d
cbar.ax.set_yticklabels(ticks)
#set nice tickmarks on image
plt.gca().set_xticks(range(d.shape[1]))
plt.gca().set_yticks(range(d.shape[0]))

plt.show()
由于可能无法直观地了解如何将数组d以所需的形状绘制出来,即作为2D数组,这里有两种转换输入数据列的方法:
import numpy as np

x = np.array([0,1,0,1])
y  = np.array([ 0,0,1,1])
d_original = np.array([-2,0,1,3])

#### Method 1 ####
# Intuitive method.
# Assumption:
#    * Indexing in x and y start at 0
#    * every index pair occurs exactly once.
# Create an empty array of shape (n+1,m+1)
#   where n is the maximum index in y and
#         m is the maximum index in x
d = np.zeros((y.max()+1 , x.max()+1), dtype=np.int)
for k in range(len(d_original)) :
    d[y[k],x[k]] = d_original[k]
print d

#### Method 2 ####
# Fast method
# Additional assumption:
#  indizes in x and y are ordered exactly such
#  that y is sorted ascendingly first,
#  and for each index in y, x is sorted.
# In this case the original d array can bes simply reshaped
d2 = d_original.reshape((y.max()+1 , x.max()+1))
print d2https://stackoverflow.com/questions/40891664
复制相似问题
腾讯云开发者

Copyright © 2013 - 2026 Tencent Cloud. All Rights Reserved. 腾讯云 版权所有
深圳市腾讯计算机系统有限公司 ICP备案/许可证号:粤B2-20090059 ![]() 粤公网安备44030502008569号
粤公网安备44030502008569号
腾讯云计算(北京)有限责任公司 京ICP证150476号 | 京ICP备11018762号