
fdcu ylim不适用于绘图包: hydroTSM - logaritmic轴
我试图使用hydroTSM包绘制一个流持续时间曲线,使用fdcu.matrix函数。不幸的是,我不能设法增加或减少y轴长度。我用ylim=c(低数字,高数字)尝试过。
当这不起作用时,我试图将包复制到R中,这样我就可以作为一个函数运行它并调整它。但不幸的是,fdcu.matrix在没有需求(HydroTSM)的情况下无法运行。
(可在https://github.com/cran/hydroTSM/blob/master/R/fdcu.R查阅)
我如何手动或自动调整ylim到数据范围..?
这是我数据矩阵的一部分:
dput(m.fdc011:20,1:5) 结构(c(1、2、3、4、5、6、7、8、9、10、11、12、13、14、15、16、17、18、19、20、6.45、6.45、6.45、6.45、6.372、6.372、6.529、7.09、3.8、8.015、8.277、9.361、10.41、10.705、9.548、8.811、9.176、8.631、8.542、8.3658.189、8.102、7.588、7.42、7.254、7.09、7.008、6.927、6.847、6.767、6.687、6.687、6.687、6.687、6.847、6.927、1.008、6.927、7.09、7.758、8.277、7.929、7.843、7.673、7.588、7.588、7.588、7.588、7.588、7.42、7.428.811,9.927,8.631,8.189,7.673,7.42,7.254,7.008,7.008,17.397,NA,NA,16.782,15.82),.Dim = c(20L,5L),.Dimnames = list(NULL,c("DayOfYear",1970年,1971年),( "1972“、”1973“)
# Plot with multiple flow duration curves & legend:
require(hydroTSM)
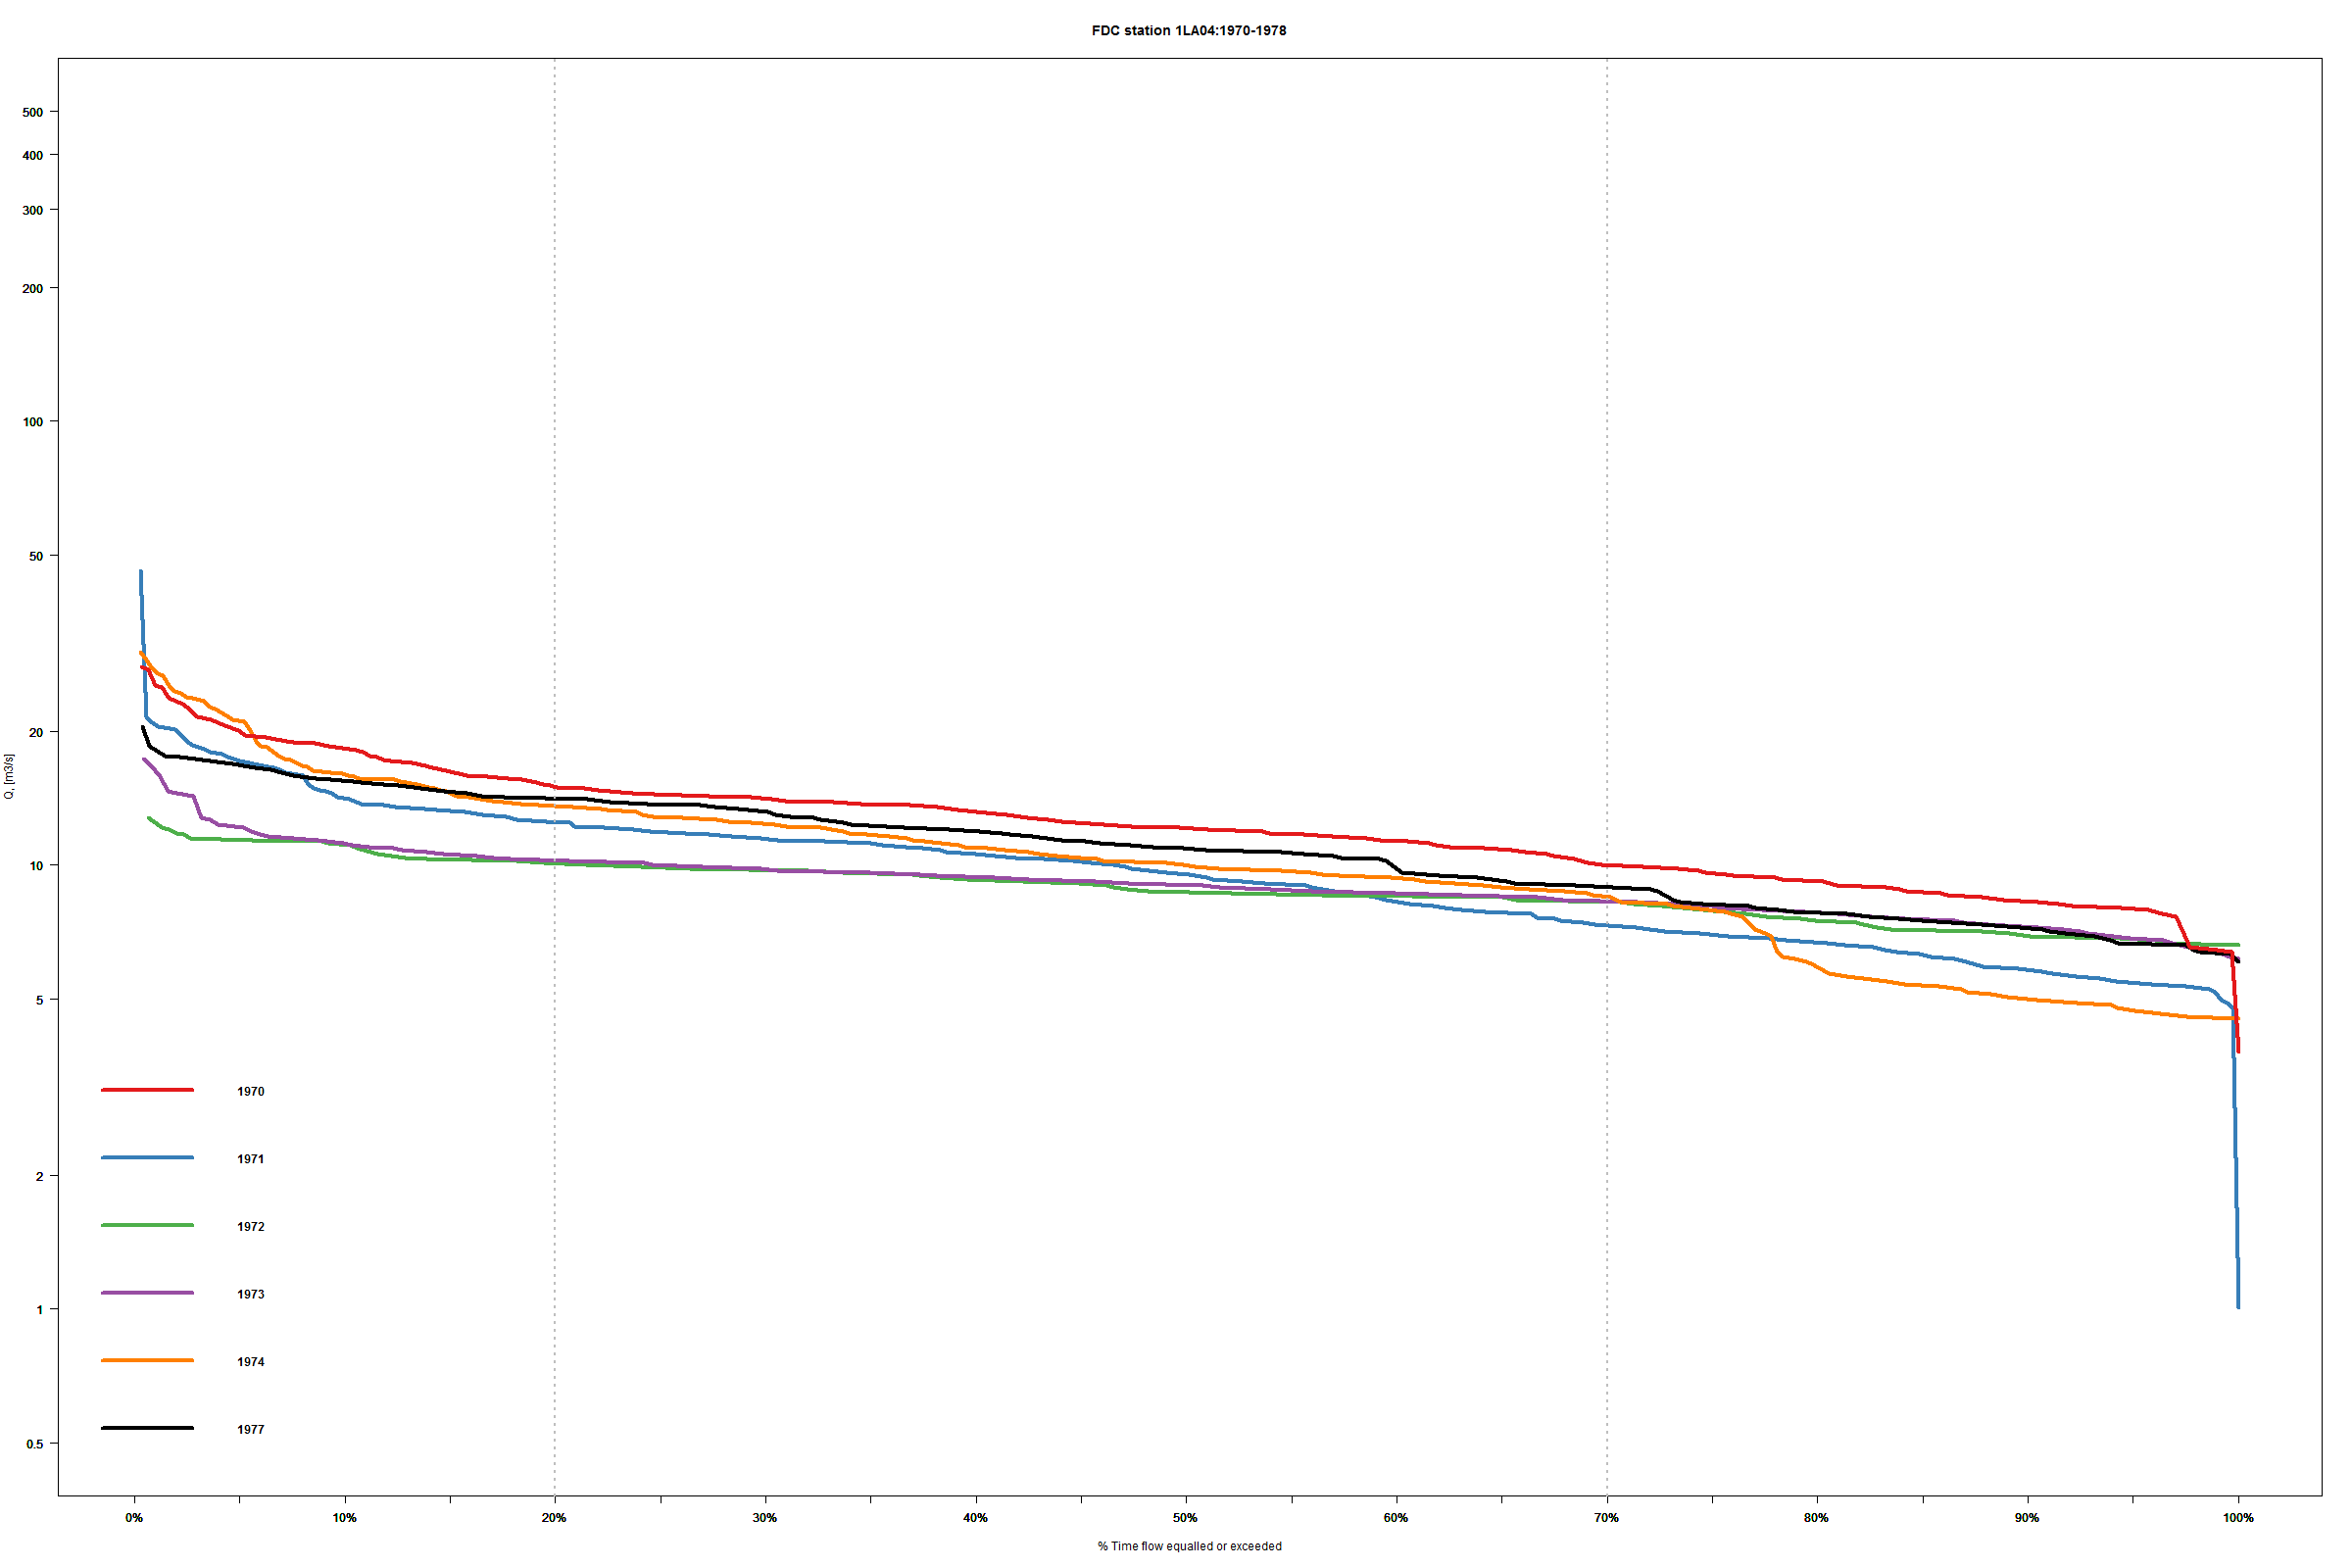
fdcu.matrix(m.fdc01[,-1], lband=m.fdc01[,-1], uband=m.fdc01[,-1], sim=m.fdc[,-1], plot=TRUE,
main ="FDC station 1LA04:1970-1978", xlab="% Time flow equalled or exceeded",
ylab="Q, [m3/s]", ylim=c(1,50),yat=c(0.01,0.02,0.05, 0.1,0.2,0.5, 1,2,5,10,20,50,100),
bands.col = "white", col=col_matsel, lwd=mat_lwd,leg.txt="",
leg.cex=0.5,leg.pos="auto",cex.axis=1,thr.shw=FALSE)
legend("bottomleft",legendtextsel,col=col_matsel, lwd=4, y.intersp=1,bty="n",cex=1)
回答 1
Stack Overflow用户
发布于 2016-11-24 14:59:26
我觉得这是个虫子。我建议你联系开发人员。当fdcu.matrix()在算法中使用fdcu()时,fdcu.matrix()没有将ylim的信息提供给fdcu()。通过复制原始代码和只删除一个术语,您可以轻松地修改fdcu.matrix()。
制备
运行fdcu.matrix并复制输出(即原始代码)。
使您的函数(几乎所有都已粘贴)
fdcu.matrix2 <- ""paste""和删除参数,ylim。
供参考
fdcu.matrix2 <-
function (x, lband, uband, sim, lQ.thr = 0.7, hQ.thr = 0.2, plot = TRUE,
    log = "y", main = "Flow Duration Curve", xlab = "% Time flow equalled or exceeded",
    ylab = "Q, [m3/s]", ylim, yat = c(0.01, 0.1, 1), xat = c(0.01, ...
                        ^^^^^ delete!!
示例
require(hydroTSM)
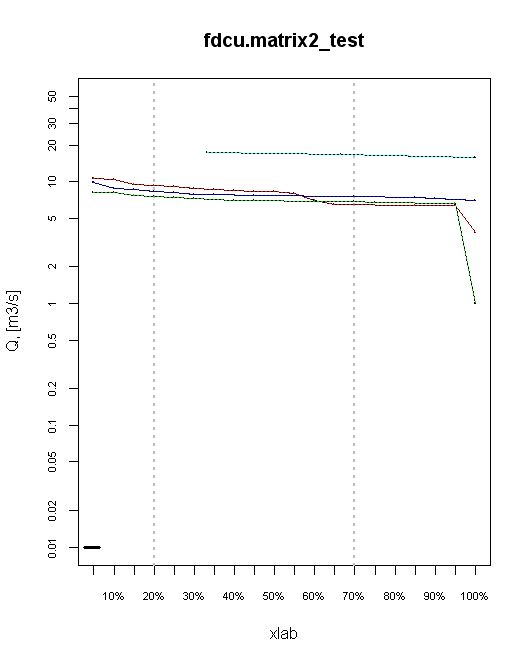
fdcu.matrix2(m.fdc01[,-1], lband=m.fdc01[,-1], uband=m.fdc01[,-1], sim=m.fdc01[,-1],
plot=TRUE, main ="fdcu.matrix2_test", xlab="xlab", ylab="Q, [m3/s]",
ylim=c(1,50), yat=c(0.01,0.02,0.05, 0.1,0.2,0.5, 1,2,5,10,20,50),
bands.col="white", leg.txt="", leg.cex=0.5, leg.pos="auto",
cex.axis=0.7, thr.shw=FALSE)
# [note] yat and pretty(ylim) are ylabels
# [note2 (edited)]
# when log = "y", ylim[1] is disregarded and 0.01 is used instead of it.
https://stackoverflow.com/questions/40777239
复制相似问题
腾讯云开发者

Copyright © 2013 - 2026 Tencent Cloud. All Rights Reserved. 腾讯云 版权所有
深圳市腾讯计算机系统有限公司 ICP备案/许可证号:粤B2-20090059 ![]() 粤公网安备44030502008569号
粤公网安备44030502008569号
腾讯云计算(北京)有限责任公司 京ICP证150476号 | 京ICP备11018762号