
事务控制器的for侦听器摘要报告表中的“总量”是什么意思?
我有一个事务控制器的测试计划,在控制器内部我有2个http取样器。当生成汇总报告表时,我有输出
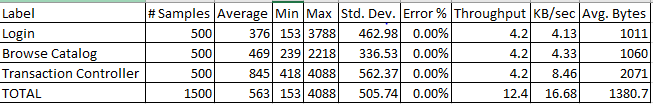
在事务控制器的监听器摘要报告表中,Total的含义是什么?为什么我有1500在总数,在事务控制器,我有500 (结合从2个采样器)。我的理解是,总数应该是1000 (来自2个取样器)或500 (来自一个事务控制器)。
回答 1
Stack Overflow用户
发布于 2016-11-23 13:02:50
总行只是对报告的所有行进行汇总。(http采样器及事务控制器(如有的话)。
以下是计算Total行值的方法:
#Total Samples = all rows Samples addition (= 500 + 500 + 500)
#Total min = min of all rows min, min(153, 239, 418) = 153
#Total max = max of all rows max, max(3788, 2218, 4008) = 4088
#Total throughput = all rows throughput addition (= 4.2 + 4.2 + 4.2)Transaction被定义为多个HTTP请求(取样器)的集合。您可以使用事务控制器来了解与一个事务相关的一系列请求的集体响应时间。
实时示例:加载任何web应用程序的主页,触发多个HTTP请求来加载资源,如图像、.js、.css。在JMeter中,每个HTTP请求都表示为HTTP。默认情况下,您可以在取样器级别获得这些响应时间。但你想知道overall response time to load the page。因此,将所有这些请求分组在一个transaction controller下,它根据所有子采样器/请求计算总体度量,从而给出加载页面的总体响应时间,即在事务级别。
事务控制器(TC)行值定义如下:
#TC Samples = how many times the transaction is performed (= number of times any of its child sampler, http request, is sent i.e., 500)
#TC min = sum of min response times of all child samplers (153+239) // min resposne time to perform the transaction
#TC max = sum of max response times of all child samplers (3788+2218) // max resposne time to perform the transaction
#TC throughput = each child sampler throughput (= 4.2)https://stackoverflow.com/questions/40764689
复制相似问题
腾讯云开发者

Copyright © 2013 - 2026 Tencent Cloud. All Rights Reserved. 腾讯云 版权所有
深圳市腾讯计算机系统有限公司 ICP备案/许可证号:粤B2-20090059 ![]() 粤公网安备44030502008569号
粤公网安备44030502008569号
腾讯云计算(北京)有限责任公司 京ICP证150476号 | 京ICP备11018762号