
为gggket2.2.0中断的gtable_add_grob代码寻找解决方法
在具有多个方面变量的图中,ggplot2重复“外部”变量的facet标签,而不是在“内部”变量的所有级别上有一个跨越面带。我有一些代码,我一直在使用gtable_add_grob包中的gtable来用一个跨越面带来覆盖重复的外部面标签。
不幸的是,由于面带的grob结构发生了变化,此代码不再适用于ggplot2 2.2.0。具体来说,在以前版本的ggplot2中,每行的面标签都有自己的一组grobs。但是,在2.2.0版本中,每个平面标签的垂直堆栈看起来都是一个grob。这破坏了我的代码,我不知道如何修复它。
下面是一个来自an SO question I answered a few months ago的具体示例:
# Data
df = structure(list(location = structure(c(1L, 1L, 1L, 1L, 1L, 1L,
    1L, 1L, 1L, 1L, 2L, 2L, 2L, 2L, 2L, 2L, 2L, 2L, 2L, 2L, 1L, 1L,
    1L, 1L, 1L, 1L, 1L, 1L, 1L, 1L, 2L, 2L, 2L, 2L, 2L, 2L, 2L, 2L,
    2L, 2L), .Label = c("SF", "SS"), class = "factor"), species = structure(c(1L,
    1L, 1L, 1L, 1L, 1L, 1L, 1L, 1L, 1L, 1L, 1L, 1L, 1L, 1L, 1L, 1L,
    1L, 1L, 1L, 2L, 2L, 2L, 2L, 2L, 2L, 2L, 2L, 2L, 2L, 2L, 2L, 2L,
    2L, 2L, 2L, 2L, 2L, 2L, 2L), .Label = c("AGR", "LKA"), class = "factor"),
        position = structure(c(1L, 1L, 1L, 1L, 1L, 2L, 2L, 2L, 2L,
        2L, 1L, 1L, 1L, 1L, 1L, 2L, 2L, 2L, 2L, 2L, 1L, 1L, 1L, 1L,
        1L, 2L, 2L, 2L, 2L, 2L, 1L, 1L, 1L, 1L, 1L, 2L, 2L, 2L, 2L,
        2L), .Label = c("top", "bottom"), class = "factor"), density = c(0.41,
        0.41, 0.43, 0.33, 0.35, 0.43, 0.34, 0.46, 0.32, 0.32, 0.4,
        0.4, 0.45, 0.34, 0.39, 0.39, 0.31, 0.38, 0.48, 0.3, 0.42,
        0.34, 0.35, 0.4, 0.38, 0.42, 0.36, 0.34, 0.46, 0.38, 0.36,
        0.39, 0.38, 0.39, 0.39, 0.39, 0.36, 0.39, 0.51, 0.38)), .Names = c("location",
    "species", "position", "density"), row.names = c(NA, -40L), class = "data.frame")

# Begin with a regular ggplot with three facet levels
p=ggplot(df, aes("", density)) +
  geom_boxplot(width=0.7, position=position_dodge(0.7)) +
  theme_bw() +
  facet_grid(. ~ species + location +  position) +
  theme(panel.margin=unit(0,"lines"),
        strip.background=element_rect(color="grey30", fill="grey90"),
        panel.border=element_rect(color="grey90"),
        axis.ticks.x=element_blank()) +
  labs(x="")
我们从一个有三个层面的情节开始。
现在,我们将用跨越条覆盖前两个面条,这样我们就不会有重复的带标签:
pg = ggplotGrob(p)
# Add spanning strip labels for species
pos = c(4,11)
for (i in 1:2) {
pg <- gtable_add_grob(pg,
list(rectGrob(gp=gpar(col="grey50", fill="grey90")),
textGrob(unique(densityAGRLKA$species)[i],
gp=gpar(cex=0.8))), t=3,l=pos[i],b=3,r=pos[i]+7,
name=c("a","b"))
}
# Add spanning strip labels for location
pos=c(4,7,11,15)
for (i in 1:4) {
pg = gtable_add_grob(pg,
list(rectGrob(gp = gpar(col="grey50", fill="grey90")),
textGrob(rep(unique(densityAGRLKA$location),2)[i],
gp=gpar(cex=0.8))), t=4,l=pos[i],b=4,r=pos[i]+3,
name = c("c","d"))
}
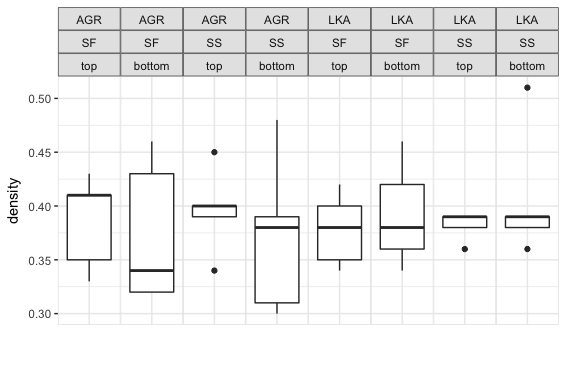
grid.draw(pg)这是ggplot2 2.1.0中的情节:
但是,如果我在ggplot2 2.2.0中尝试相同的代码,我将得到原来的情节,而不会对条形标签进行任何更改。查看原始地块p的grob结构可以看出为什么会发生这种情况。我已经在这个问题的底部粘贴了grob表。为了节省空间,我只包括了与小面带相关的行。
查看cells列时,请注意,在2.1.0版本的绘图中,每行的前两个数字为3、4或5,这表示grob相对于图中其他grob的垂直位置。在上面的代码中,t和l参数被设置为3或4的值,因为它们是我想要用生成条覆盖的小面条行。
现在看一下2.2.0版本中的cells列:注意前两个数字总是6。还请注意,小面条仅由8个grobs组成,而不是2.1.0版本中的24个。在2.2.0版本中,每个由三个方面标签组成的堆栈现在似乎是一个单独的grob,而不是三个单独的grob。因此,即使我将t和b参数在gtable_add_grob中更改为6,也涵盖了所有三个方面条。下面是一个例子:
pg = ggplotGrob(p)

# Add spanning strip labels for species
pos = c(4,11)
for (i in 1:2) {
  pg <- gtable_add_grob(pg,
                        list(rectGrob(gp=gpar(col="grey50", fill="grey90")),
                             textGrob(unique(densityAGRLKA$species)[i],
                                      gp=gpar(cex=0.8))), t=6,l=pos[i],b=6,r=pos[i]+7,
                        name=c("a","b"))
}
因此,在进行了非常冗长的介绍之后,我的问题是:如何使用ggplot2版本2.2.0创建跨面条,这些条看起来就像我使用gtable_add_grob和ggplot2版本2.1.0创建的那样?我希望有一个简单的调整,但如果它需要大手术,嗯,这也没关系。
gggket2.1.0
pgTableGrob (9 X 19)“布局”:45个grobs z单元格名为grob 2 1( 3- 3,4- 4)条-顶绝对grobs.绝对值Grob.147 3 2( 4- 4,4- 4)带-顶绝对Grobstrip.AbteGrob.195 3( 5- 5,4- 4)条-顶绝对grobs.绝对Grob.243 5 4( 3- 3),( 6- 6)带-顶绝对-.153 6- 5( 4- 4,6- 6)条-顶绝对-.绝对值-201 6( 5- 5,6- 6)条-顶绝对-strip.249 8( 3- 3,8- 8)条-顶绝对条.159 9 8( 4- 4,8- 8)带-顶绝对绝对GrobteGrob.207 9( 5- 5,( 8- 8)带-顶绝对Grobstrip.AbteGrob.255 11 10 ( 3- 3,10-10)带-顶绝对.绝对Grob.165 12 11 ( 4- 4,10-10)带-顶绝对Grobstrip.AbteGrobp.AbteGrob.213 12 12(5-5,10-10)条-顶绝对.AbteGrob.261 14 13 ( 3- 3,12-12)条-最高绝对Grobstrip.AbteGrob.171 15 14 ( 4- 4,12-12)条-顶绝对绝对Grobstrip.AbteGrob.219 16 15 ( 5- 5,12-12)带16 15( 5- 5,12-12)16 ( 3- 3,14-14)条-最高绝对Grobstrip.183 21 20 ( 4- 4,14-14)带-顶绝对Grobstrip.teGrob.231 21 ( 5- 5,14-14)带( 5- 5,14-14)带.279 23 22 ( 3- 3,18-18)条-顶绝对.绝对Grob.189 24 ( 4- 4,18-18)带-顶绝对.绝对Grob.237 25 ( 5- 5,18-18)条-顶绝对Grobstrip.AbteGrob.285
ggplot2 2.2.0
pgTableGrob (11 X 21)“布局”:42个grobs z单元名为grob 28 2( 6- 6,4- 4)条-t-1 g表带29 2( 6- 6,6- 6)带-t-2 gtablestrip 30 2( 6- 6,6-6),8- 8)带状-t-3 gtablestrip 31 2( 6- 6,10-10)条-t-4 gtablestrip 32 2( 6- 6,12-12)条-t-5 gtablestrip 33 2( 6- 6,14-14)带-t-6,14-14)带-t- 6,16-16)条形-t-7格表带35 2( 6- 6,18-18)条-t-8
回答 2
Stack Overflow用户
发布于 2016-11-28 07:07:15
实际上,ggplot2 v2.2.0逐列构造复杂的条带,每列都有一个grob。这可以通过提取一个条带,然后检查其结构来检查。用你的情节:
library(ggplot2)
library(gtable)
library(grid)
# Your data
df = structure(list(location = structure(c(1L, 1L, 1L, 1L, 1L, 1L,
1L, 1L, 1L, 1L, 2L, 2L, 2L, 2L, 2L, 2L, 2L, 2L, 2L, 2L, 1L, 1L,
1L, 1L, 1L, 1L, 1L, 1L, 1L, 1L, 2L, 2L, 2L, 2L, 2L, 2L, 2L, 2L,
2L, 2L), .Label = c("SF", "SS"), class = "factor"), species = structure(c(1L,
1L, 1L, 1L, 1L, 1L, 1L, 1L, 1L, 1L, 1L, 1L, 1L, 1L, 1L, 1L, 1L,
1L, 1L, 1L, 2L, 2L, 2L, 2L, 2L, 2L, 2L, 2L, 2L, 2L, 2L, 2L, 2L,
2L, 2L, 2L, 2L, 2L, 2L, 2L), .Label = c("AGR", "LKA"), class = "factor"),
position = structure(c(1L, 1L, 1L, 1L, 1L, 2L, 2L, 2L, 2L,
2L, 1L, 1L, 1L, 1L, 1L, 2L, 2L, 2L, 2L, 2L, 1L, 1L, 1L, 1L,
1L, 2L, 2L, 2L, 2L, 2L, 1L, 1L, 1L, 1L, 1L, 2L, 2L, 2L, 2L,
2L), .Label = c("top", "bottom"), class = "factor"), density = c(0.41,
0.41, 0.43, 0.33, 0.35, 0.43, 0.34, 0.46, 0.32, 0.32, 0.4,
0.4, 0.45, 0.34, 0.39, 0.39, 0.31, 0.38, 0.48, 0.3, 0.42,
0.34, 0.35, 0.4, 0.38, 0.42, 0.36, 0.34, 0.46, 0.38, 0.36,
0.39, 0.38, 0.39, 0.39, 0.39, 0.36, 0.39, 0.51, 0.38)), .Names = c("location",
"species", "position", "density"), row.names = c(NA, -40L), class = "data.frame")
# Your ggplot with three facet levels
p=ggplot(df, aes("", density)) +
geom_boxplot(width=0.7, position=position_dodge(0.7)) +
theme_bw() +
facet_grid(. ~ species + location + position) +
theme(panel.spacing=unit(0,"lines"),
strip.background=element_rect(color="grey30", fill="grey90"),
panel.border=element_rect(color="grey90"),
axis.ticks.x=element_blank()) +
labs(x="")
# Get the ggplot grob
pg = ggplotGrob(p)
# Get the left most strip
index = which(pg$layout$name == "strip-t-1")
strip1 = pg$grobs[[index]]
# Draw the strip
grid.newpage()
grid.draw(strip1)
# Examine its layout
strip1$layout
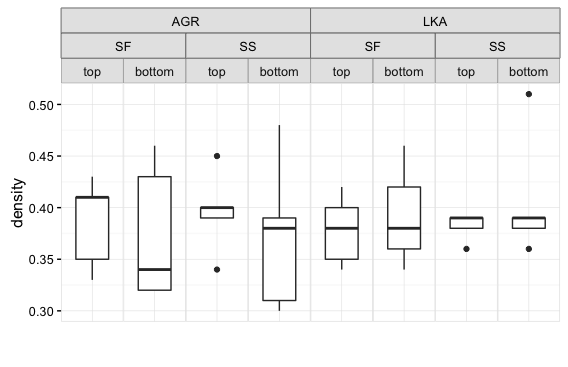
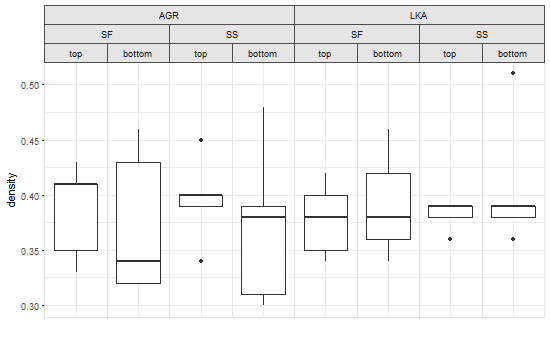
gtable_show_layout(strip1)获得外部条形标签‘跨越’内部标签的一种粗糙的方法是从头开始构造条带:
# Get the strips, as a list, from the original plot
strip = list()
for(i in 1:8) {
   index = which(pg$layout$name == paste0("strip-t-",i))
   strip[[i]] = pg$grobs[[index]]
}

# Construct gtable to contain the new strip
newStrip  = gtable(widths = unit(rep(1, 8), "null"), heights = strip[[1]]$heights)

## Populate the gtable
# Top row
for(i in 1:2) {
   newStrip = gtable_add_grob(newStrip, strip[[4*i-3]][1],
           t = 1, l = 4*i-3, r = 4*i)
}

# Middle row
for(i in 1:4){
   newStrip = gtable_add_grob(newStrip, strip[[2*i-1]][2],
         t = 2, l = 2*i-1, r = 2*i)
}

# Bottom row
for(i in 1:8) {
   newStrip = gtable_add_grob(newStrip, strip[[i]][3],
       t = 3, l = i)
}

# Put the strip into the plot
# (It could be better to remove the original strip.
# In this case, with a coloured background, it doesn't matter)
pgNew = gtable_add_grob(pg, newStrip, t = 7, l = 5, r = 19)

# Draw the plot
grid.newpage()
grid.draw(pgNew)或使用矢量化的gtable_add_grob (请参阅注释):
pg = ggplotGrob(p)

# Get a list of strips from the original plot
strip = lapply(grep("strip-t", pg$layout$name), function(x) {pg$grobs[[x]]})

# Construct gtable to contain the new strip
newStrip  = gtable(widths = unit(rep(1, 8), "null"), heights = strip[[1]]$heights)

## Populate the gtable
# Top row
cols = seq(1, by = 4, length.out = 2)
newStrip = gtable_add_grob(newStrip, lapply(strip[cols], `[`, 1), t = 1, l = cols, r = cols + 3)

# Middle row
cols = seq(1, by = 2, length.out = 4)
newStrip = gtable_add_grob(newStrip, lapply(strip[cols], `[`, 2), t = 2, l = cols, r = cols + 1)

# Bottom row
newStrip = gtable_add_grob(newStrip, lapply(strip, `[`, 3), t = 3, l = 1:8)

# Put the strip into the plot
pgNew = gtable_add_grob(pg, newStrip, t = 7, l = 5, r = 19)

# Draw the plot
grid.newpage()
grid.draw(pgNew)

Stack Overflow用户
发布于 2016-12-06 01:58:13
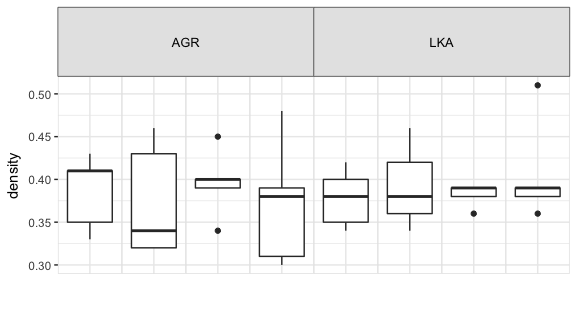
编辑以允许不同宽度的面板(即scales = "free_x"、space = "free_x")。
这一尝试获取原始的ggplot,提取一些信息,然后构造一个包含重叠条带的新grob。功能不太好,但能用.到目前为止。它要求安装plyr。
library(ggplot2)
library(grid)
library(gtable)


df = structure(list(location = structure(c(1L, 1L, 1L, 1L, 1L, 1L,
    1L, 1L, 1L, 1L, 2L, 2L, 2L, 2L, 2L, 2L, 2L, 2L, 2L, 2L, 1L, 1L,
    1L, 1L, 1L, 1L, 1L, 1L, 1L, 1L, 2L, 2L, 2L, 2L, 2L, 2L, 2L, 2L,
    2L, 2L), .Label = c("SF", "SS"), class = "factor"), species = structure(c(1L,
    1L, 1L, 1L, 1L, 1L, 1L, 1L, 1L, 1L, 1L, 1L, 1L, 1L, 1L, 1L, 1L,
    1L, 1L, 1L, 2L, 2L, 2L, 2L, 2L, 2L, 2L, 2L, 2L, 2L, 2L, 2L, 2L,
    2L, 2L, 2L, 2L, 2L, 2L, 2L), .Label = c("AGR", "LKA"), class = "factor"),
        position = structure(c(1L, 1L, 1L, 1L, 1L, 2L, 2L, 2L, 2L,
        2L, 1L, 1L, 1L, 1L, 1L, 2L, 2L, 2L, 2L, 2L, 1L, 1L, 1L, 1L,
        1L, 2L, 2L, 2L, 2L, 2L, 1L, 1L, 1L, 1L, 1L, 2L, 2L, 2L, 2L,
        2L), .Label = c("top", "bottom"), class = "factor"), density = c(0.41,
        0.41, 0.43, 0.33, 0.35, 0.43, 0.34, 0.46, 0.32, 0.32, 0.4,
        0.4, 0.45, 0.34, 0.39, 0.39, 0.31, 0.38, 0.48, 0.3, 0.42,
        0.34, 0.35, 0.4, 0.38, 0.42, 0.36, 0.34, 0.46, 0.38, 0.36,
        0.39, 0.38, 0.39, 0.39, 0.39, 0.36, 0.39, 0.51, 0.38)), .Names = c("location",
    "species", "position", "density"), row.names = c(NA, -40L), class = "data.frame")

# Begin with a regular ggplot with three facet levels
p=ggplot(df, aes("", density)) +
  geom_boxplot(width=0.7, position=position_dodge(0.7)) +
  theme_bw() +
  facet_grid(. ~ species + location + position) +
  theme(panel.spacing=unit(0,"lines"),
        strip.background=element_rect(color="grey30", fill="grey90"),
        panel.border=element_rect(color="grey90"),
        axis.ticks.x=element_blank()) +
  labs(x="")

## The function to get overlapping strip labels
OverlappingStripLabels = function(plot) {

# Get the ggplot grob
g = ggplotGrob(plot)

### Collect some information about the strips from the plot
# Get a list of strips
strip = lapply(grep("strip-t", g$layout$name), function(x) {g$grobs[[x]]})

# Number of strips
NumberOfStrips = sum(grepl(pattern = "strip-t", g$layout$name))

# Number of rows
NumberOfRows = length(strip[[1]])

# Panel spacing and it's unit
plot_theme <- function(p) {
   plyr::defaults(p$theme, theme_get())
}
PanelSpacing = plot_theme(plot)$panel.spacing
unit = attr(PanelSpacing, "unit")

# Map the boundaries of the new strips
Nlabel = vector("list", NumberOfRows)
map = vector("list", NumberOfRows)
for(i in 1:NumberOfRows) {

  for(j in 1:NumberOfStrips) {
   Nlabel[[i]][j] = getGrob(grid.force(strip[[j]][i]), gPath("GRID.text"), grep = TRUE)$label
  }

map[[i]][1] = TRUE
for(j in 2:NumberOfStrips) {
   map[[i]][j] = Nlabel[[i]][j] != Nlabel[[i]][j-1]
   }
}


## Construct gtable to contain the new strip
# Set the widths of the strips, based on widths of the panels and PanelSpacing
panel = subset(g$layout, grepl("panel", g$layout$name), l, drop = TRUE)
StripWidth = list()
for(i in seq_along(panel)) StripWidth[[i]] = unit.c(g$width[panel[i]], PanelSpacing)

newStrip  = gtable(widths = unit.c(unit(unlist(StripWidth), c("null", unit)))[-2*NumberOfStrips],
                   heights = strip[[1]]$heights)


## Populate the gtable
seqLeft = list()
for(i in 1:NumberOfRows) {
   Left = which(map[[i]] == TRUE)
   seqLeft[[i]] = if((i-1) < 1) 2*Left - 1 else sort(unique(c(seqLeft[[i-1]], 2*Left - 1)))
   seqRight = c(seqLeft[[i]][-1] -2, (2*NumberOfStrips-1))
   newStrip = gtable_add_grob(newStrip, lapply(strip[(seqLeft[[i]]+1)/2], `[`, i), t = i, l = seqLeft[[i]], r = seqRight)
}

## Put the strip into the plot
# Get the locations of the original strips
pos = subset(g$layout, grepl("strip-t", g$layout$name), t:r)

## Use these to position the new strip
pgNew = gtable_add_grob(g, newStrip, t = unique(pos$t), l = min(pos$l), r = max(pos$r))

return(pgNew)
}

## Draw the plot
grid.newpage()
grid.draw(OverlappingStripLabels(p))
中断这个函数可能不会太困难,但我尝试了在数据上使用,因为行的排序并不是这样的均匀。
p1 = ggplot(mtcars, aes("", hp)) +
  geom_boxplot(width=0.7, position=position_dodge(0.7)) +
  theme_bw() +
  facet_grid(. ~ vs + am + carb, labeller = label_both) +
  theme(panel.spacing=unit(0.2,"lines"),
        strip.background=element_rect(color="grey30", fill="grey90"),
        panel.border=element_rect(color="grey90"),
        axis.ticks.x=element_blank()) +
  labs(x="")

  grid.draw(OverlappingStripLabels(p1))

p2 = ggplot(mtcars, aes("", hp)) +
  geom_boxplot(width=0.7, position=position_dodge(0.7)) +
  theme_bw() +
  facet_grid(. ~ vs + carb +  am, labeller = label_both) +
  theme(panel.spacing=unit(0.2,"lines"),
        strip.background=element_rect(color="grey30", fill="grey90"),
        panel.border=element_rect(color="grey90"),
        axis.ticks.x=element_blank()) +
  labs(x="")

 grid.draw(OverlappingStripLabels(p2))


df = structure(list(id = 1:19,
category1 = c("X", "X", "X", "X", "X", "X", "X", "X", "X", "Y", "Y", "Y", "Y", "Y", "Y", "Y", "Y", "Y", "Y"),
category2 = c(21L, 21L, 21L, 22L, 22L, 22L, 22L, 22L, 22L, 23L, 23L, 23L, 24L, 24L, 24L, 25L, 25L, 26L, 26L),
category3 = c("C1", "C2", "C3", "D1", "D2", "D3", "D5", "D6", "D7", "E1", "E2", "E3", "F1", "F2", "F3", "G1", "G2", "H1", "H2"),
freq = c(4L, 7L, 4L, 28L, 20L, 0L, 1L, 4L, 1L, 17L, 33L, 31L, 20L, 20L, 21L, 15L, 18L, 12L, 13L)),
.Names = c("id", "category1", "category2", "category3", "freq"), class = "data.frame", row.names = c(NA, -19L))

p3 = ggplot(df, aes(category3, freq)) +
  geom_bar(stat = "identity") +
  facet_grid(. ~ category1 + category2, scale = "free_x", space = "free_x")

grid.draw(OverlappingStripLabels(p3))https://stackoverflow.com/questions/40732543
复制相似问题
腾讯云开发者

Copyright © 2013 - 2026 Tencent Cloud. All Rights Reserved. 腾讯云 版权所有
深圳市腾讯计算机系统有限公司 ICP备案/许可证号:粤B2-20090059 ![]() 粤公网安备44030502008569号
粤公网安备44030502008569号
腾讯云计算(北京)有限责任公司 京ICP证150476号 | 京ICP备11018762号