
偏离中心的加权histogram2d?
我试图从一组观测到的恒星中生成一个PSF模型。我正在学习我 in 这个答案 (下面的MCVE)提供的一个很好的例子。
我所用的五星看上去如下:
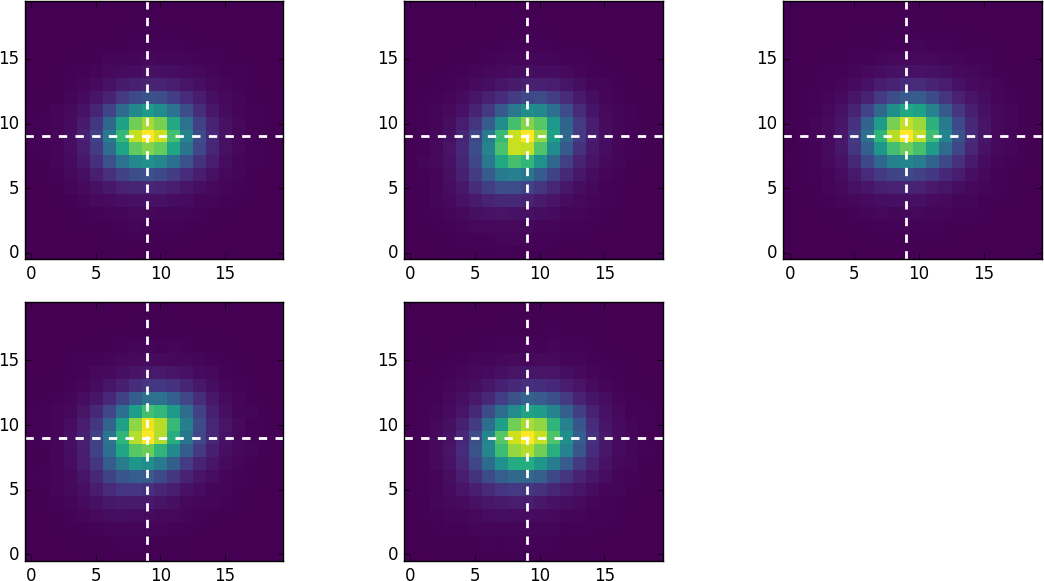
中心(峰值强度)在垃圾箱[9, 9]处。他们通过numpy's hitsogram2d进行组合的结果如下:
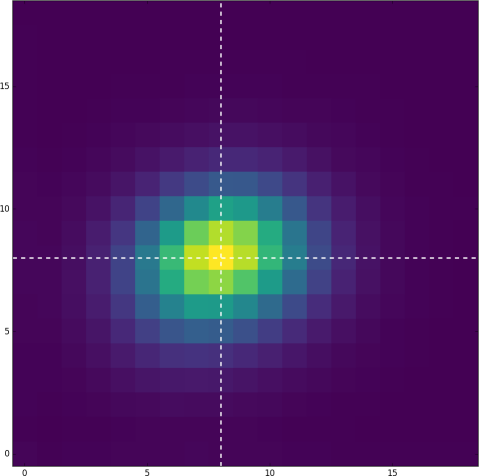
显示一个峰值密度在垃圾箱[8, 8]。要将其中心设置为[9, 9],我必须获得质心(见下文)如下:
cx, cy = np.array([1.] * len(stars)), np.array([1.] * len(stars))而不是。为什么会这样呢?
import numpy as np
from matplotlib import pyplot as plt

stars = # Uploaded here: http://pastebin.com/tjLqM9gQ

fig, ax = plt.subplots(2, 3, figsize=(5, 5))
for i in range(5):
    ax.flat[i].imshow(
        stars[i], cmap=plt.cm.viridis, interpolation='nearest',
        origin='lower', vmin=0.)
    ax.flat[i].axhline(9., ls='--', lw=2, c='w')
    ax.flat[i].axvline(9., ls='--', lw=2, c='w')
fig.tight_layout()

# (nstars, ny, nx) pixel coordinates relative to each centroid
# pixel coordinates (integer)
x, y = np.mgrid[:20, :20]
# centroids (float)
cx, cy = np.array([0.] * len(stars)), np.array([0.] * len(stars))
dx = cx[:, None, None] + x[None, ...]
dy = cy[:, None, None] + y[None, ...]

# 2D weighted histogram
bins = np.linspace(0., 20., 20)
h, xe, ye = np.histogram2d(dx.ravel(), dy.ravel(), bins=bins,
                           weights=stars.ravel())
fig, ax = plt.subplots(1, 1, subplot_kw={'aspect': 'equal'})
ax.hold(True)
ax.imshow(h, cmap=plt.cm.viridis, interpolation='nearest',
          origin='lower', vmin=0.)
ax.axhline(8., ls='--', lw=2, c='w')
ax.axvline(8., ls='--', lw=2, c='w')

plt.show()回答 1
Stack Overflow用户
发布于 2016-11-14 21:11:37
其原因是,直方图不是集中在单星强度分布中心的点(9,9)上,是因为生成直方图的代码在柱状图的垃圾箱周围移动。
正如我在评论中所建议的,保持简单。我们不需要图谋就能看到问题。另外,我不明白这些dx dy是什么,所以让我们避免它们。
然后,我们可以通过
import numpy as np

stars = # Uploaded here: http://pastebin.com/tjLqM9gQ

# The argmax of a single star results in (9,9)
single_star_argmax  = np.unravel_index(np.argmax(stars[0]), stars[0].shape)

# Create a meshgrid of coordinates (0,1,...,19) times (0,1,...,19)
y,x = np.mgrid[:len(stars[0,:,0]), :len(stars[0,0,:])]
# duplicating the grids
xcoord, ycoord = np.array([x]*len(stars)),  np.array([y]*len(stars))
# compute histogram with coordinates as x,y
# and [20,20] bins
h, xe, ye = np.histogram2d(xcoord.ravel(), ycoord.ravel(),
                           bins=[len(stars[0,0,:]), len(stars[0,:,0])],
                           weights=stars.ravel())

# The argmax of the combined stars results in (9,9)
combined_star_argmax =  np.unravel_index(np.argmax(h), h.shape)

print single_star_argmax
print combined_star_argmax
print single_star_argmax == combined_star_argmax
# prints:
# (9, 9)
# (9, 9)
# True原始代码中唯一的问题是行bins = np.linspace(0., 20., 20),它在0到20之间创建了20点,
0. 1.05263158 2.10526316 ... 18.94736842 20.
这样就可以将bin大小缩放到~1.05,并允许您的argmax“更早”地出现在预期的范围内。
你真正想要的是0到19,np.linspace(0,19,20)或np.arange(0,20)之间的20分
为了避免这些错误,可以简单地将原始数组的长度作为参数bins=20。
https://stackoverflow.com/questions/40594520
复制相似问题
腾讯云开发者

Copyright © 2013 - 2026 Tencent Cloud. All Rights Reserved. 腾讯云 版权所有
深圳市腾讯计算机系统有限公司 ICP备案/许可证号:粤B2-20090059 ![]() 粤公网安备44030502008569号
粤公网安备44030502008569号
腾讯云计算(北京)有限责任公司 京ICP证150476号 | 京ICP备11018762号