
如何将饼图向下移动?
如何将饼图向下移动?
提问于 2016-11-07 12:55:19
我用下面的代码创建了一个pie chart。
customeractivity
.width(262)
.height(120)
.slicesCap(5)
.colors(d3.scale.ordinal().range(["#FFDA33","#05BCDC","#EA7262","#0071CF","#58A531","#E51F30"]))
.dimension(Age_GrpDimension)
.group(Age_GrpGroup)
.legend(dc.legend().x(0).y(16).itemHeight(15).gap(3))

.on('pretransition', function(chart) {
    chart.selectAll('text.pie-slice').text(function(d) {
        return  Math.round(dc.utils.printSingleValue((d.endAngle - d.startAngle) / (2*Math.PI) * 100)*10)/10+ '%';
    })
});

customeractivity.render();
pie chart看起来是这样的:
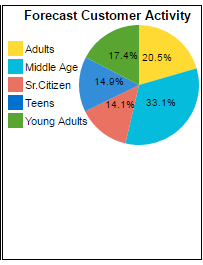
有人知道怎么把这张饼图往下挪吗?我试着添加space,但它有一些副作用。所以我现在被困住了。请帮帮我。
回答 1
Stack Overflow用户
回答已采纳
发布于 2016-11-08 05:14:37
对标题预测客户活动使用标记,然后使用padding向下移动图表。试试下面的代码。
<div class="x_content" style="margin: 20px 0px 0px -24px;color:black;width:200px;height:255px;background:#ffffff;border:1px solid black;">
<h style="margin: 3px 0px 0px 0px;font-size:13px;"><b> Forecast Customer Activity</b></h>
<div id="customeractivity" style="margin: 0px 0px 0px 0px;padding:30px 0px 0px 0px;">
</div>
</div>页面原文内容由Stack Overflow提供。腾讯云小微IT领域专用引擎提供翻译支持
原文链接:
https://stackoverflow.com/questions/40465752
复制相关文章
相似问题
腾讯云开发者

Copyright © 2013 - 2026 Tencent Cloud. All Rights Reserved. 腾讯云 版权所有
深圳市腾讯计算机系统有限公司 ICP备案/许可证号:粤B2-20090059 ![]() 粤公网安备44030502008569号
粤公网安备44030502008569号
腾讯云计算(北京)有限责任公司 京ICP证150476号 | 京ICP备11018762号