
自定义ggbiplot的边框
自定义ggbiplot的边框
提问于 2016-11-02 18:35:51
考虑到以下代码使用了通过devtools::install.github()提供的ggbiplot库:
library(ggbiplot)
data(iris)
log.ir <- log(iris[, 1:4])
ir.species <- iris[, 5]
ir.pca <- prcomp(log.ir, center = TRUE, scale. = TRUE)
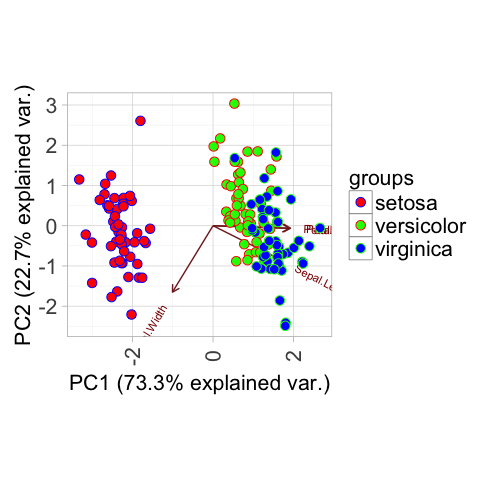
g <- ggbiplot(ir.pca, obs.scale = 1, var.scale = 1, groups = ir.species)
g <- g + theme(legend.direction = 'vertical', legend.position = 'right')
g <- g + scale_color_manual(values=c("blue", "red", "green"))
print(g)根据分组自定义数据点边界的最佳方法是什么?我使用scale_color_manual()来自定义这些数据点的颜色,但是我想不出有什么方法可以用于边框。
谢谢
回答 1
Stack Overflow用户
回答已采纳
发布于 2016-11-02 20:07:23
假设你想调整数据点本身的边框.
ggbiplot()调用本身不会给您提供这种灵活性,但是设置alpha = 0将使ggbiplot绘制的点变得不可见或实际上100%透明。然后,您可以使用geom_point()调用创建一个单独的层,其中指定shape为具有填充(中间)和颜色(边框)美学的5个形状(21-25)之一。
ggbiplot(ir.pca, obs.scale = 1, var.scale = 1, groups = ir.species, alpha = 0) +
    theme(legend.direction = 'vertical', legend.position = 'right') +
    scale_color_manual(values=c("blue", "red", "green")) +
    scale_fill_manual(values = c("red", "green", "blue")) + # just offset by one to show
    geom_point(size = 3, shape = 21, aes(fill = groups, color = groups))
在您的问题中包含您使用的包只能通过devtools::install.github()获得,而不是标准的install.packages()。
页面原文内容由Stack Overflow提供。腾讯云小微IT领域专用引擎提供翻译支持
原文链接:
https://stackoverflow.com/questions/40387366
复制相关文章
相似问题
腾讯云开发者

Copyright © 2013 - 2026 Tencent Cloud. All Rights Reserved. 腾讯云 版权所有
深圳市腾讯计算机系统有限公司 ICP备案/许可证号:粤B2-20090059 ![]() 粤公网安备44030502008569号
粤公网安备44030502008569号
腾讯云计算(北京)有限责任公司 京ICP证150476号 | 京ICP备11018762号