
Qcache研错误:未知的文件格式。由php x调试生成的文件
Qcache研错误:未知的文件格式。由php x调试生成的文件
提问于 2016-10-28 05:52:54
我试图使用xdebug来分析用php7编写的应用程序。
我编写了一个设置以下ini设置的脚本:
ini_set('xdebug.trace_format',1); // Note: I tried 0 and 2 here as well
ini_set('xdebug.profiler_enable',1);
xdebug_start_trace('/tmp/cachegrind.out');
// RUN CODE HERE
xdebug_stop_trace();
运行脚本可以像我预期的那样创建cache差速文件:
root@host:/# ls /tmp | grep cachegrind
cachegrind.out.0028fd.xt
cachegrind.out.0072ab.xt
cachegrind.out.009b09.xt
cachegrind.out.025ac3.xt
下面是缓存文件的前几行,以便该格式是可见的:
Version: 2.4.1
File format: 4
TRACE START [2016-10-28 05:26:57]
2   3784    1   0.242945    2692856
2   3785    0   0.242955    2692800 DI\Container->set   1       /path/public/api/index.php   100
2   3785    1   0.242966    2692800
2   3786    0   0.242973    2692800 spl_autoload_call   0       /path/public/api/index.php   103
3   3787    0   0.242982    2692896 Fuel\Core\Autoloader::load  1       /path/public/api/index.php   103
4 3788 0 0.242990 2692896 strpos 0 /path/fuel/core/classes/autoloader.php 219但是,当我试图在qcachegrind中打开这个文件时,它无法打开:
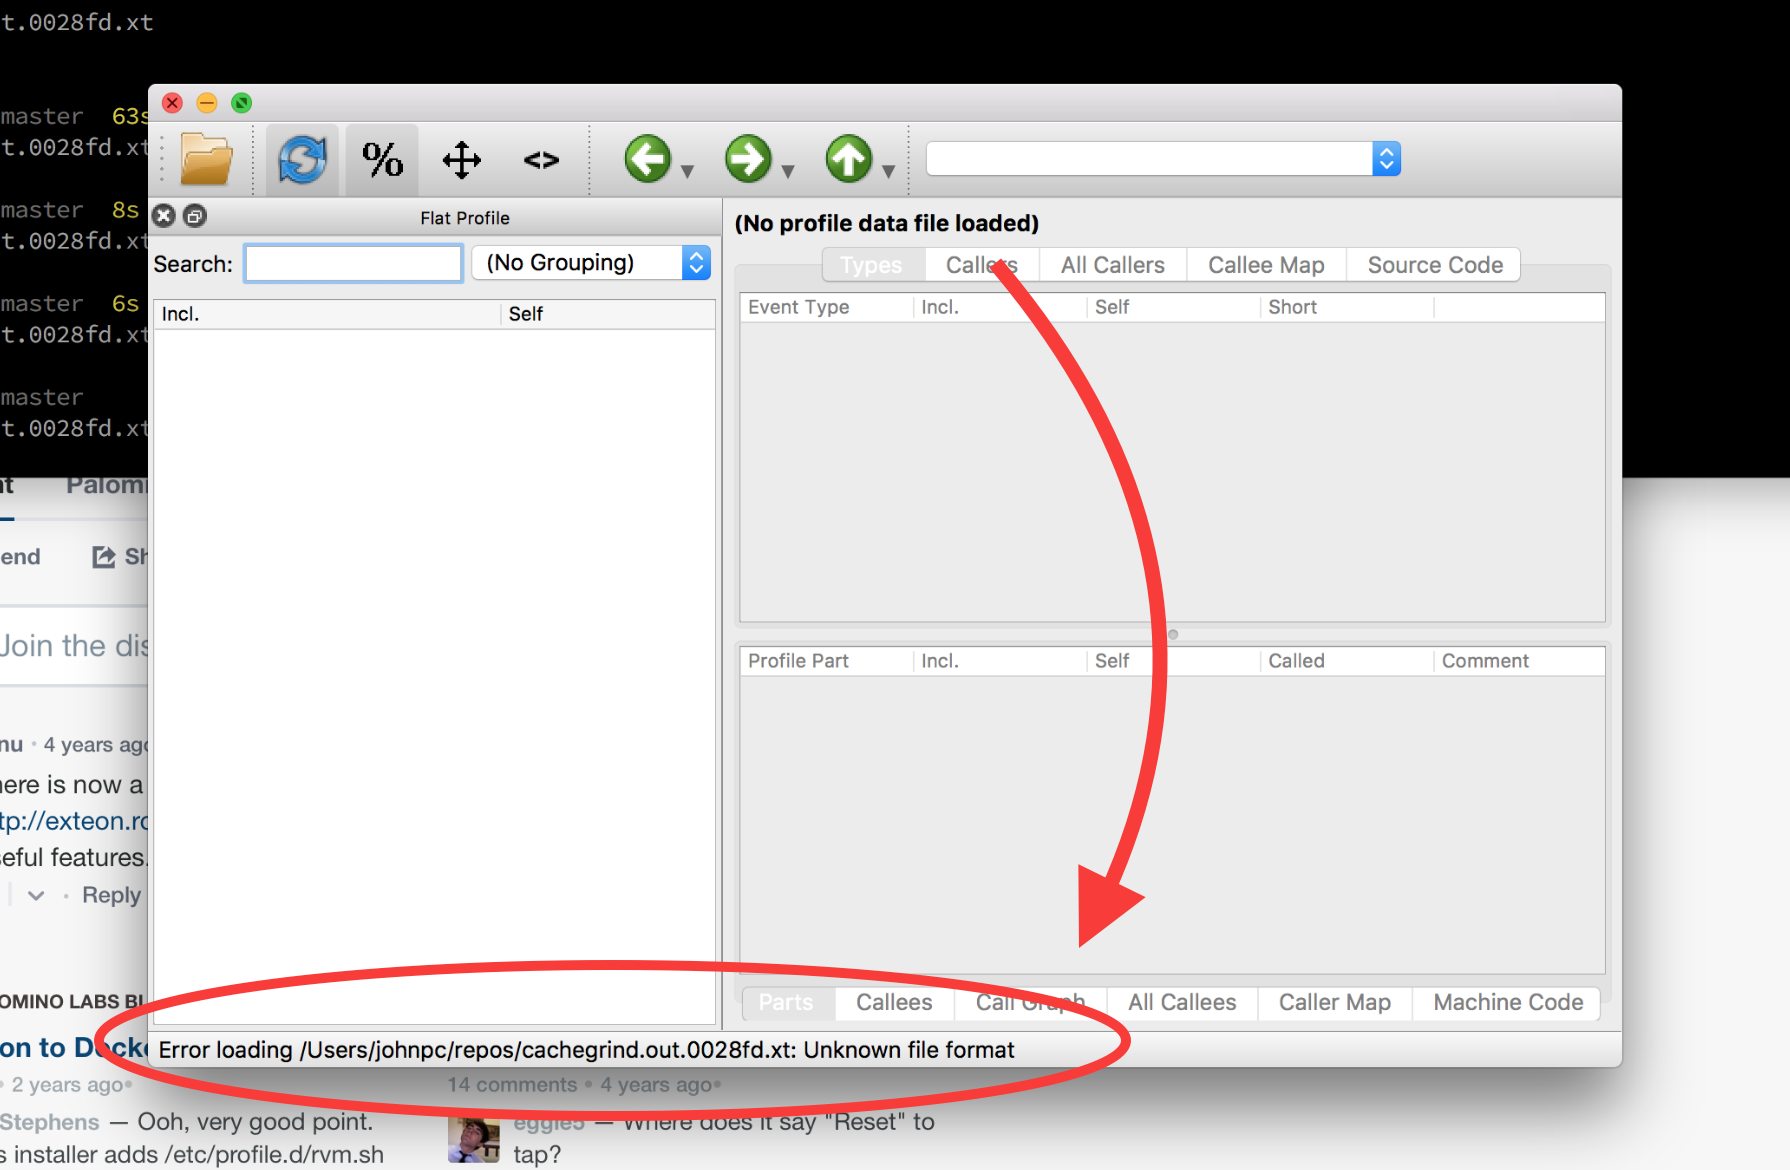
错误消息是:“加载/path/to/cachegrind/file:未知文件格式时出错
有人知道这是怎么回事吗?我希望能够使用这样的工具来分析我的应用程序。
我还花了30美元来尝试在MCG中打开文件,但是这个应用程序在打开这些文件时立即崩溃。
顺便提一句,该文件相当大,但不太大,我希望应用程序会抓狂:
❯ ls -al /Users/johnpc/repos/cachegrind.out.094ffa.xt
-rw-r--r-- 1 johnpc staff 62744095 Oct 28 02:13 /Users/johnpc/repos/cachegrind.out.094ffa.xt回答 1
Stack Overflow用户
回答已采纳
发布于 2016-10-28 07:59:19
该文件是一个跟踪文件,而不是回调文件。
似乎您将ini中的trace_output_name和profiler_output_name设置为相同的字符串,或者试图打开错误的文件。您需要在ini中设置profiling_*变量。参见:X调试文档中的“剖析PHP脚本”
示例分析输出如下所示:
    version: 1
    creator: xdebug 2.1.1rc1
    cmd: /Users/foo/bar/test1.php
    part: 1
    positions: line

    events: Time

    fl=php:internal
fn=php::microtime当您因文件大小而出现问题时,也可以从profilingviewer.com试用该应用程序。
页面原文内容由Stack Overflow提供。腾讯云小微IT领域专用引擎提供翻译支持
原文链接:
https://stackoverflow.com/questions/40298853
复制相关文章
相似问题
腾讯云开发者

Copyright © 2013 - 2026 Tencent Cloud. All Rights Reserved. 腾讯云 版权所有
深圳市腾讯计算机系统有限公司 ICP备案/许可证号:粤B2-20090059 ![]() 粤公网安备44030502008569号
粤公网安备44030502008569号
腾讯云计算(北京)有限责任公司 京ICP证150476号 | 京ICP备11018762号