
ggbiplot更改组颜色和标记
ggbiplot更改组颜色和标记
提问于 2016-10-27 14:58:16
在这个例子中,ggbiplot脚本图有3组,我如何改变标记颜色和形状?
library(ggbiplot)
data(wine)
wine.pca <- prcomp(wine, scale. = TRUE)
ggbiplot(wine.pca, obs.scale = 1, var.scale = 1, group=wine.class,
         varname.size = 3, labels.size=3,
         ellipse = TRUE, circle = TRUE) +
  scale_color_discrete(name = '') +
  geom_point(aes(colour=wine.class), size = 3) +
  theme(legend.direction ='horizontal',
legend.position = 'top')回答 1
Stack Overflow用户
回答已采纳
发布于 2016-10-28 12:47:30
下面这些对我来说很有用。
ggbiplot(wine.pca, obs.scale = 1, var.scale = 1, group=wine.class,
     varname.size = 3, labels.size=3, ellipse = TRUE, circle = TRUE) +
scale_color_manual(name="Variety", values=c("orange", "purple", "green")) +
scale_shape_manual(name="Variety", values=c(17:19)) +
geom_point(aes(colour=wine.class, shape=wine.class), size = 3) +
theme(legend.direction ="horizontal",
      legend.position = "top")
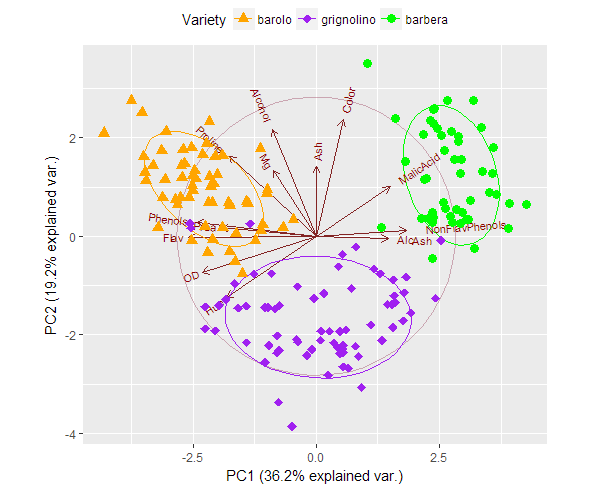
对于传说来说,诀窍似乎是将相同的name用于scale_color_manual和scale_shape_manual。
页面原文内容由Stack Overflow提供。腾讯云小微IT领域专用引擎提供翻译支持
原文链接:
https://stackoverflow.com/questions/40287943
复制相关文章
相似问题
腾讯云开发者

Copyright © 2013 - 2026 Tencent Cloud. All Rights Reserved. 腾讯云 版权所有
深圳市腾讯计算机系统有限公司 ICP备案/许可证号:粤B2-20090059 ![]() 粤公网安备44030502008569号
粤公网安备44030502008569号
腾讯云计算(北京)有限责任公司 京ICP证150476号 | 京ICP备11018762号