
用Python循环裁剪NetCDF文件
用Python循环裁剪NetCDF文件
提问于 2016-10-21 13:29:13
我正在从事一个项目,该项目将原始二进制雷达数据从国家气象局ftp站点导入到服务器。使用天气和气候工具包数据导出工具,我将数据转换为netCDF文件。以下是-h文件上的"ncdump .nc“命令的结果:
netcdf last {
dimensions:
        lat = 800 ;
        lon = 1200 ;
        time = 1 ;
variables:
        double cref(time, lat, lon) ;
                cref:long_name = "Level-III Composite Reflectivity (16 levels / 248 nm)" ;
                cref:missing_value = -999. ;
                cref:units = "dBZ" ;
        double lat(lat) ;
                lat:units = "degrees_north" ;
                lat:spacing = "0.010995604400775773" ;
                lat:datum = "NAD83 - NOAA Standard" ;
        double lon(lon) ;
                lon:units = "degrees_east" ;
                lon:spacing = "0.010983926942902655" ;
                lon:datum = "NAD83 - NOAA Standard" ;
        int time(time) ;
                time:units = "seconds since 1970-1-1" ;

// global attributes:
                :title = "Level-III Composite Reflectivity (16 levels / 248 nm)  22:23:47 UTC  10/20/2016" ;
                :Conventions = "CF-1.0" ;
                :History = "Exported to NetCDF-3 CF-1.0 conventions by the NOAA Weather and Climate Toolkit (version 3.7.9)  \n",
                    "Export Date: Thu Oct 20 16:11:07 EDT 2016" ;
                :geographic_datum_ESRI_PRJ = "GEOGCS[\"GCS_North_American_1983\",DATUM[\"D_North_American_1983\",SPHEROID[\"GRS_1980\",6378137,298.257222101]],PRIMEM[\"Greenwich\",0],UNIT[\"Degree\",0.0174532925199433]]" ;
                :geographic_datum_OGC_WKT = "GEOGCS[\"NAD83\", DATUM[\"NAD83\", SPHEROID[\"GRS_1980\", 6378137.0, 298.25722210100002],TOWGS84[0,0,0,0,0,0,0]], PRIMEM[\"Greenwich\", 0.0], UNIT[\"degree\",0.017453292519943295], AXIS[\"Longitude\",EAST], AXIS[\"Latitude\",NORTH]]" ;
}
我想为cref变量找到最大的条目,使用python中的netCDF4和numpy库可以很容易地做到这一点:
import netCDF4
import numpy

netcdf = netCDF4.Dataset("last.nc")
var = netcdf.variables['cref']
print(numpy.nanmax(var))
print(numpy.nanmin(var))但是,我希望过滤netCDF文件,以便只在给定lat/lon的一定距离内找到最大值和最小值。换句话说,我希望在指定的lat/lon周围“裁剪”一个指定半径的圆。我通过另一个SO线程找到了how to crop a square,但不知道一个圆是如何工作的。
回答 1
Stack Overflow用户
回答已采纳
发布于 2016-10-24 10:35:00
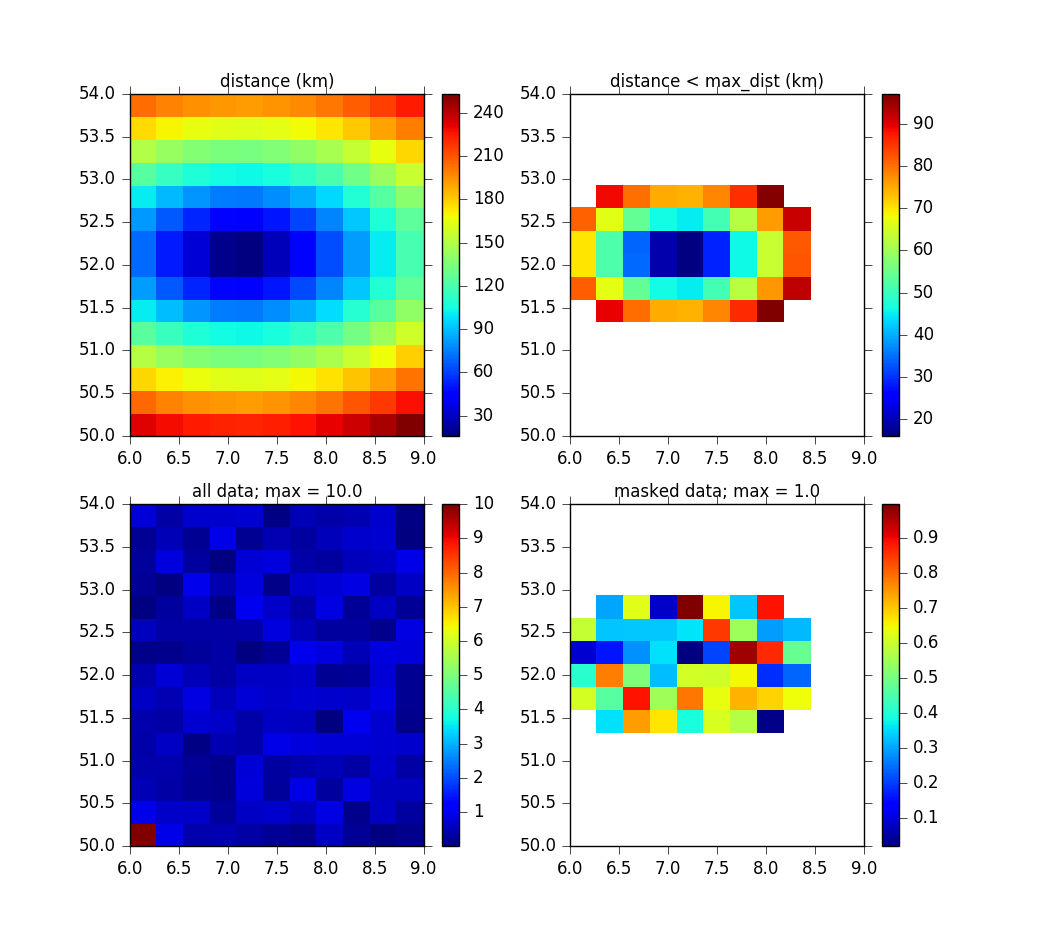
我将计算中心与每个lat/lon对(2D网格)之间的距离,并使用它构造一个掩码,您可以将其应用于数据。一旦蒙面,您可以再次简单地使用numpy函数来计算统计数据,如max()。
例如,使用来自haversine()的https://stackoverflow.com/a/4913653/3581217函数,修改为矢量化版本,可以直接应用于numpy数组:
import numpy as np
import matplotlib.pylab as pl

def haversine(lon1, lat1, lon2, lat2):
    # convert decimal degrees to radians
    lon1 = np.deg2rad(lon1)
    lon2 = np.deg2rad(lon2)
    lat1 = np.deg2rad(lat1)
    lat2 = np.deg2rad(lat2)

    # haversine formula
    dlon = lon2 - lon1
    dlat = lat2 - lat1
    a = np.sin(dlat/2)**2 + np.cos(lat1) * np.cos(lat2) * np.sin(dlon/2)**2
    c = 2 * np.arcsin(np.sqrt(a))
    r = 6371
    return c * r

# Latitude / longitude grid
lat = np.linspace(50,54,16)
lon = np.linspace(6,9,12)

# Center coordinates
clat = 52
clon = 7

max_dist = 100      # max distance in km

# Calculate distance between center and all other lat/lon pairs
distance = haversine(lon[:,np.newaxis], lat, clon, clat)

# Mask distance array where distance > max_dist
distance_m = np.ma.masked_greater(distance, max_dist)

# Dummy data
data = np.random.random(size=[lon.size, lat.size])

# Test: set a value outside the max_dist circle to a large value:
data[0,0] = 10

# Mask the data array based on the distance mask
data_m = np.ma.masked_where(distance > max_dist, data)

pl.figure()
pl.subplot(221)
pl.title('distance (km)')
pl.pcolormesh(lon, lat, np.transpose(distance))
pl.colorbar()

pl.subplot(222)
pl.title('distance < max_dist (km)')
pl.pcolormesh(lon, lat, np.transpose(distance_m))
pl.colorbar()

pl.subplot(223)
pl.title('all data; max = {0:.1f}'.format(data.max()))
pl.pcolormesh(lon, lat, np.transpose(data))
pl.colorbar()

pl.subplot(224)
pl.title('masked data; max = {0:.1f}'.format(data_m.max()))
pl.pcolormesh(lon, lat, np.transpose(data_m))
pl.colorbar()
其结果是:
页面原文内容由Stack Overflow提供。腾讯云小微IT领域专用引擎提供翻译支持
原文链接:
https://stackoverflow.com/questions/40177960
复制相关文章
相似问题
腾讯云开发者

Copyright © 2013 - 2026 Tencent Cloud. All Rights Reserved. 腾讯云 版权所有
深圳市腾讯计算机系统有限公司 ICP备案/许可证号:粤B2-20090059 ![]() 粤公网安备44030502008569号
粤公网安备44030502008569号
腾讯云计算(北京)有限责任公司 京ICP证150476号 | 京ICP备11018762号