
geom_area图的平滑数据
geom_area图的平滑数据
提问于 2016-10-19 14:11:24
我有这样的数据:
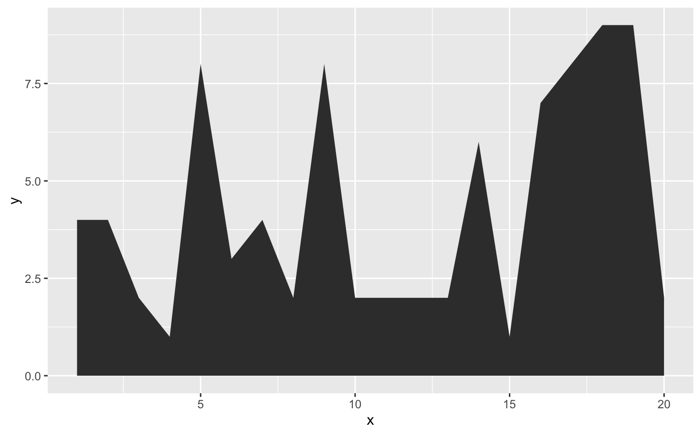
df <- tibble(
    x = 1:20,
    y = c(4, 4, 2, 1, 8, 3, 4, 2, 8, 2, 2, 2, 2, 6, 1, 7, 8, 9, 9, 2)
)
图上,看上去如下:
df %>%
    ggplot(aes(x, y)) +
    geom_area()
但这张图确实令人不快。我怎样才能把锯齿状的边缘平滑成这样的东西:
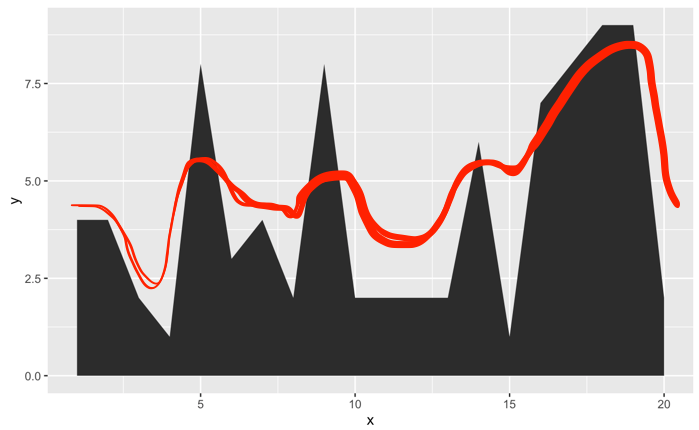
谢谢!
回答 1
Stack Overflow用户
回答已采纳
发布于 2016-11-30 16:03:18
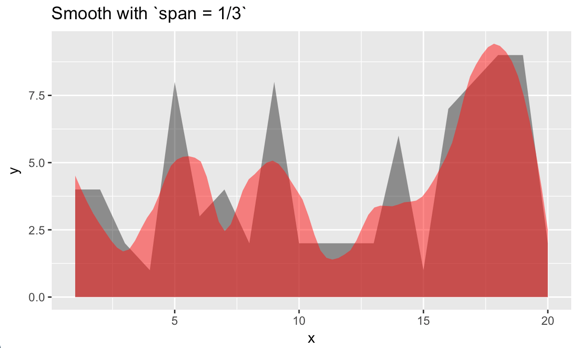
扩展Axeman的注释:光滑可以由span参数控制。
示例1:
df %>%
    ggplot(aes(x, y)) +
    # original, delete if desired
    geom_area(alpha = 1/2) +
    stat_smooth(
        geom = 'area', method = 'loess', span = 1/3,
        alpha = 1/2, fill = "red") +
    labs(title = "Smooth with `span = 1/3`")
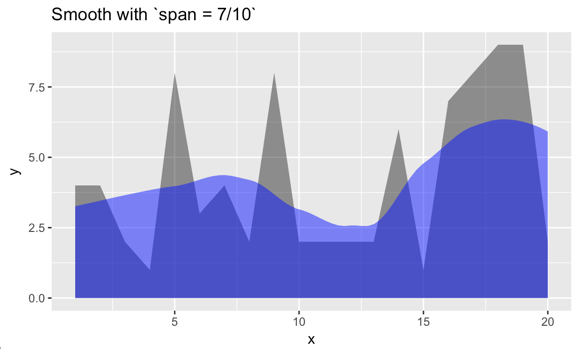
示例2:
df %>%
    ggplot(aes(x, y)) +
    geom_area(alpha = 1/2) +
    # original, delete if desired
    stat_smooth(
        geom = 'area', method = 'loess', span = 7/10,
        alpha = 1/2, fill = "blue") +
    labs(title = "Smooth with `span = 7/10`")
页面原文内容由Stack Overflow提供。腾讯云小微IT领域专用引擎提供翻译支持
原文链接:
https://stackoverflow.com/questions/40133833
复制相关文章
相似问题
腾讯云开发者

Copyright © 2013 - 2026 Tencent Cloud. All Rights Reserved. 腾讯云 版权所有
深圳市腾讯计算机系统有限公司 ICP备案/许可证号:粤B2-20090059 ![]() 粤公网安备44030502008569号
粤公网安备44030502008569号
腾讯云计算(北京)有限责任公司 京ICP证150476号 | 京ICP备11018762号