
用非正则角绘制三维球面参数曲面
用非正则角绘制三维球面参数曲面
提问于 2016-10-12 13:28:08
我有一个数据文件,它是数值计算的结果。这个文件样本的数量作为一个球角r(th,ph)的函数。
th ph r
0.012 1.456 24
0.014 1.25 23.5
......
球面角度跨越球的整个参数面,但不形成明显的网格。为了简单起见,假设球面角度是随机的。
我想绘制一个曲面来拟合这些数据。请注意,我正在绘制的曲面不是凸的。
我已经通过matlibplot和Mayavi,在任何情况下,我都需要提供一个我没有的2D数组。
回答 1
Stack Overflow用户
发布于 2017-08-30 13:53:39
我不知道我是否完全理解你的问题,但无论如何,我试图提供一个光滑的、部分随机的曲面和一个完全随机的曲面(r=f(θ,phi))的可能绘图(使用plot_surface和巧妙地)。
import scipy.signal as scsi
import numpy
import matplotlib.pyplot as plt
from mpl_toolkits.mplot3d import Axes3D
# FIRST WAY: make just a strange sphere (it works even if not continuous) - it seems a nice vase
theta = linspace(0,2*pi,100)
phi = linspace(0,pi,100) + scsi.savgol_filter(numpy.random.normal(1.5,0.5, 100),11,2)
r = scsi.savgol_filter(numpy.random.normal(2,0.2,theta.shape[0]),11,3)
# N.B. you can use the savgol_filter to 'fit' a presupposed random noise
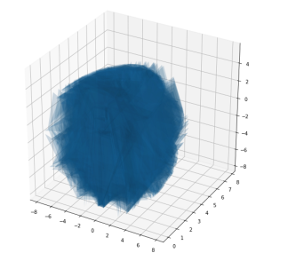
# SECOND WAY: this is instead flat random
theta = numpy.random.uniform(0,pi, 100)
phi = numpy.random.uniform(0, pi, 100)
# this would be your r = f(theta, phi)
r = theta*2 + phi # random function
x = r*outer(cos(theta),sin(phi))
y = r*outer(sin(theta),sin(phi))
z = r*outer(ones(100),cos(phi))
# plotting (std)
fig = plt.figure(figsize=(10,10))
ax = fig.gca(projection='3d')
ax.plot_surface(x,y,z, alpha=0.1)
plt.draw()
plt.show()以下是两种“方式”的std输出(按代码中的顺序排列):
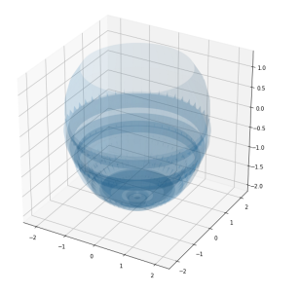
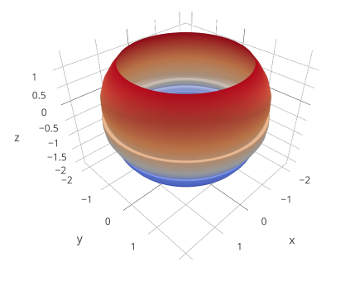
平淡的版本(表示顺序相同):
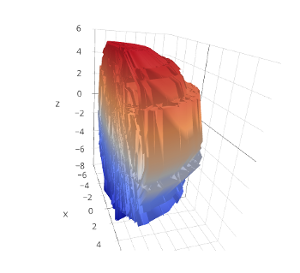
# PLOTLY VERSION - DYNAMIC PLOTTING
import plotly
import plotly.plotly as py
from plotly.graph_objs import *

data = Data([ Surface(x=x, y=y, z=z) ])
fig = Figure(data=data)
py.iplot(fig, filename='bloch-sphere-surface')
页面原文内容由Stack Overflow提供。腾讯云小微IT领域专用引擎提供翻译支持
原文链接:
https://stackoverflow.com/questions/39999883
复制相关文章
相似问题
腾讯云开发者

Copyright © 2013 - 2026 Tencent Cloud. All Rights Reserved. 腾讯云 版权所有
深圳市腾讯计算机系统有限公司 ICP备案/许可证号:粤B2-20090059 ![]() 粤公网安备44030502008569号
粤公网安备44030502008569号
腾讯云计算(北京)有限责任公司 京ICP证150476号 | 京ICP备11018762号