
如何正确使用K近邻?
如何正确使用K近邻?
提问于 2016-10-02 18:24:44
我在R中生成了一些数据,并将Bayes分类器应用于这些点。它们都被归类为“橙色”或“蓝色”。我很难从knn函数获得准确的结果,因为我认为类(“蓝色”、“橙色”)没有正确地链接到knn。
我的训练数据在一个数据帧(x, y)中。我的类在一个单独的数组中。我这样做是为了贝斯分类器-它更容易策划。但是,现在我不知道如何将我的类“插入”到knn中。使用以下代码非常不准确。我已经将k更改为许多不同的测试值,这些都是不准确的。
library(class)

x <- round(runif(100, 1, 100))
y <- round(runif(100, 1, 100))
train.df <- data.frame(x, y)

x.test <- round(runif(100, 1, 100))
y.test <- round(runif(100, 1, 100))
test.df <- data.frame(x.test, y.test)

cl <- factor(c(rep("blue", 50), rep("orange", 50)))

k <- knn(train.df, test.df, cl, k=100)同样,我的排序类在代码中更高的数组classes中。这是我的完整文件。上面的代码在最下面。
library(class)

n <- 100
x <- round(runif(n, 1, n))
y <- round(runif(n, 1, n))

# ============================================================
# Bayes Classifier + Decision Boundary Code
# ============================================================

classes <- "null"
colours <- "null"

for (i in 1:n)
{

    # P(C = j | X = x, Y = y) = prob
    # "The probability that the class (C) is orange (j) when X is some x, and Y is some y"
    # Two predictors that influence classification: x, y
    # If x and y are both under 50, there is a 90% chance of being orange (grouping)
    # If x and y and both over 50, or if one of them is over 50, grouping is blue
    # Algorithm favours whichever grouping has a higher chance of success, then plots using that colour
    # When prob (from above) is 50%, the boundary is drawn

    percentChance <- 0
    if (x[i] < 50 && y[i] < 50)
    {
        # 95% chance of orange and 5% chance of blue
        # Bayes Decision Boundary therefore assigns to orange when x < 50 and y < 50
        # "colours" is the Decision Boundary grouping, not the plotted grouping
        percentChance <- 95
        colours[i] <- "orange"
    }
    else
    {
        percentChance <- 10
        colours[i] <- "blue"
    }

    if (round(runif(1, 1, 100)) > percentChance)
    {
        classes[i] <- "blue"
    }
    else
    {
        classes[i] <- "orange"
    }
}

boundary.x <- seq(0, 100, by=1)
boundary.y <- 0
for (i in 1:101)
{
    if (i > 49)
    {
        boundary.y[i] <- -10 # just for the sake of visual consistency, real value is 0
    }
    else
    {
        boundary.y[i] <- 50
    }
}
df <- data.frame(boundary.x, boundary.y)

plot(x, y, col=classes)
lines(df, type="l", lty=2, lwd=2, col="red")

# ============================================================
# K-Nearest neighbour code
# ============================================================

#library(class)

#x <- round(runif(100, 1, 100))
#y <- round(runif(100, 1, 100))
train.df <- data.frame(x, y)

x.test <- round(runif(n, 1, n))
y.test <- round(runif(n, 1, n))
test.df <- data.frame(x.test, y.test)

cl <- factor(c(rep("blue", 50), rep("orange", 50)))

k <- knn(train.df, test.df, cl, k=(round(sqrt(n))))
谢谢你的帮助
回答 1
Stack Overflow用户
回答已采纳
发布于 2016-10-02 19:34:41
首先,为了重现性,您应该在生成一组随机数之前设置一个种子,就像runif所做的那样,或者运行任何随机的模拟/ML算法。注意,在下面的代码中,我们为生成x的所有实例设置了相同的种子,为生成y的所有实例设置了不同的种子。这样,伪随机生成的x总是相同的(但不同于y),对于y也是如此。
library(class)

n <- 100
set.seed(1)
x <- round(runif(n, 1, n))
set.seed(2)
y <- round(runif(n, 1, n))

# ============================================================
# Bayes Classifier + Decision Boundary Code
# ============================================================

classes <- "null"
colours <- "null"

for (i in 1:n)
{

    # P(C = j | X = x, Y = y) = prob
    # "The probability that the class (C) is orange (j) when X is some x, and Y is some y"
    # Two predictors that influence classification: x, y
    # If x and y are both under 50, there is a 90% chance of being orange (grouping)
    # If x and y and both over 50, or if one of them is over 50, grouping is blue
    # Algorithm favours whichever grouping has a higher chance of success, then plots using that colour
    # When prob (from above) is 50%, the boundary is drawn

    percentChance <- 0
    if (x[i] < 50 && y[i] < 50)
    {
        # 95% chance of orange and 5% chance of blue
        # Bayes Decision Boundary therefore assigns to orange when x < 50 and y < 50
        # "colours" is the Decision Boundary grouping, not the plotted grouping
        percentChance <- 95
        colours[i] <- "orange"
    }
    else
    {
        percentChance <- 10
        colours[i] <- "blue"
    }

    if (round(runif(1, 1, 100)) > percentChance)
    {
        classes[i] <- "blue"
    }
    else
    {
        classes[i] <- "orange"
    }
}

boundary.x <- seq(0, 100, by=1)
boundary.y <- 0
for (i in 1:101)
{
    if (i > 49)
    {
        boundary.y[i] <- -10 # just for the sake of visual consistency, real value is 0
    }
    else
    {
        boundary.y[i] <- 50
    }
}
df <- data.frame(boundary.x, boundary.y)

plot(x, y, col=classes)
lines(df, type="l", lty=2, lwd=2, col="red")

# ============================================================
# K-Nearest neighbour code
# ============================================================

#library(class)
set.seed(1)
x <- round(runif(n, 1, n))

set.seed(2)
y <- round(runif(n, 1, n))
train.df <- data.frame(x, y)

set.seed(1)
x.test <- round(runif(n, 1, n))
set.seed(2)
y.test <- round(runif(n, 1, n))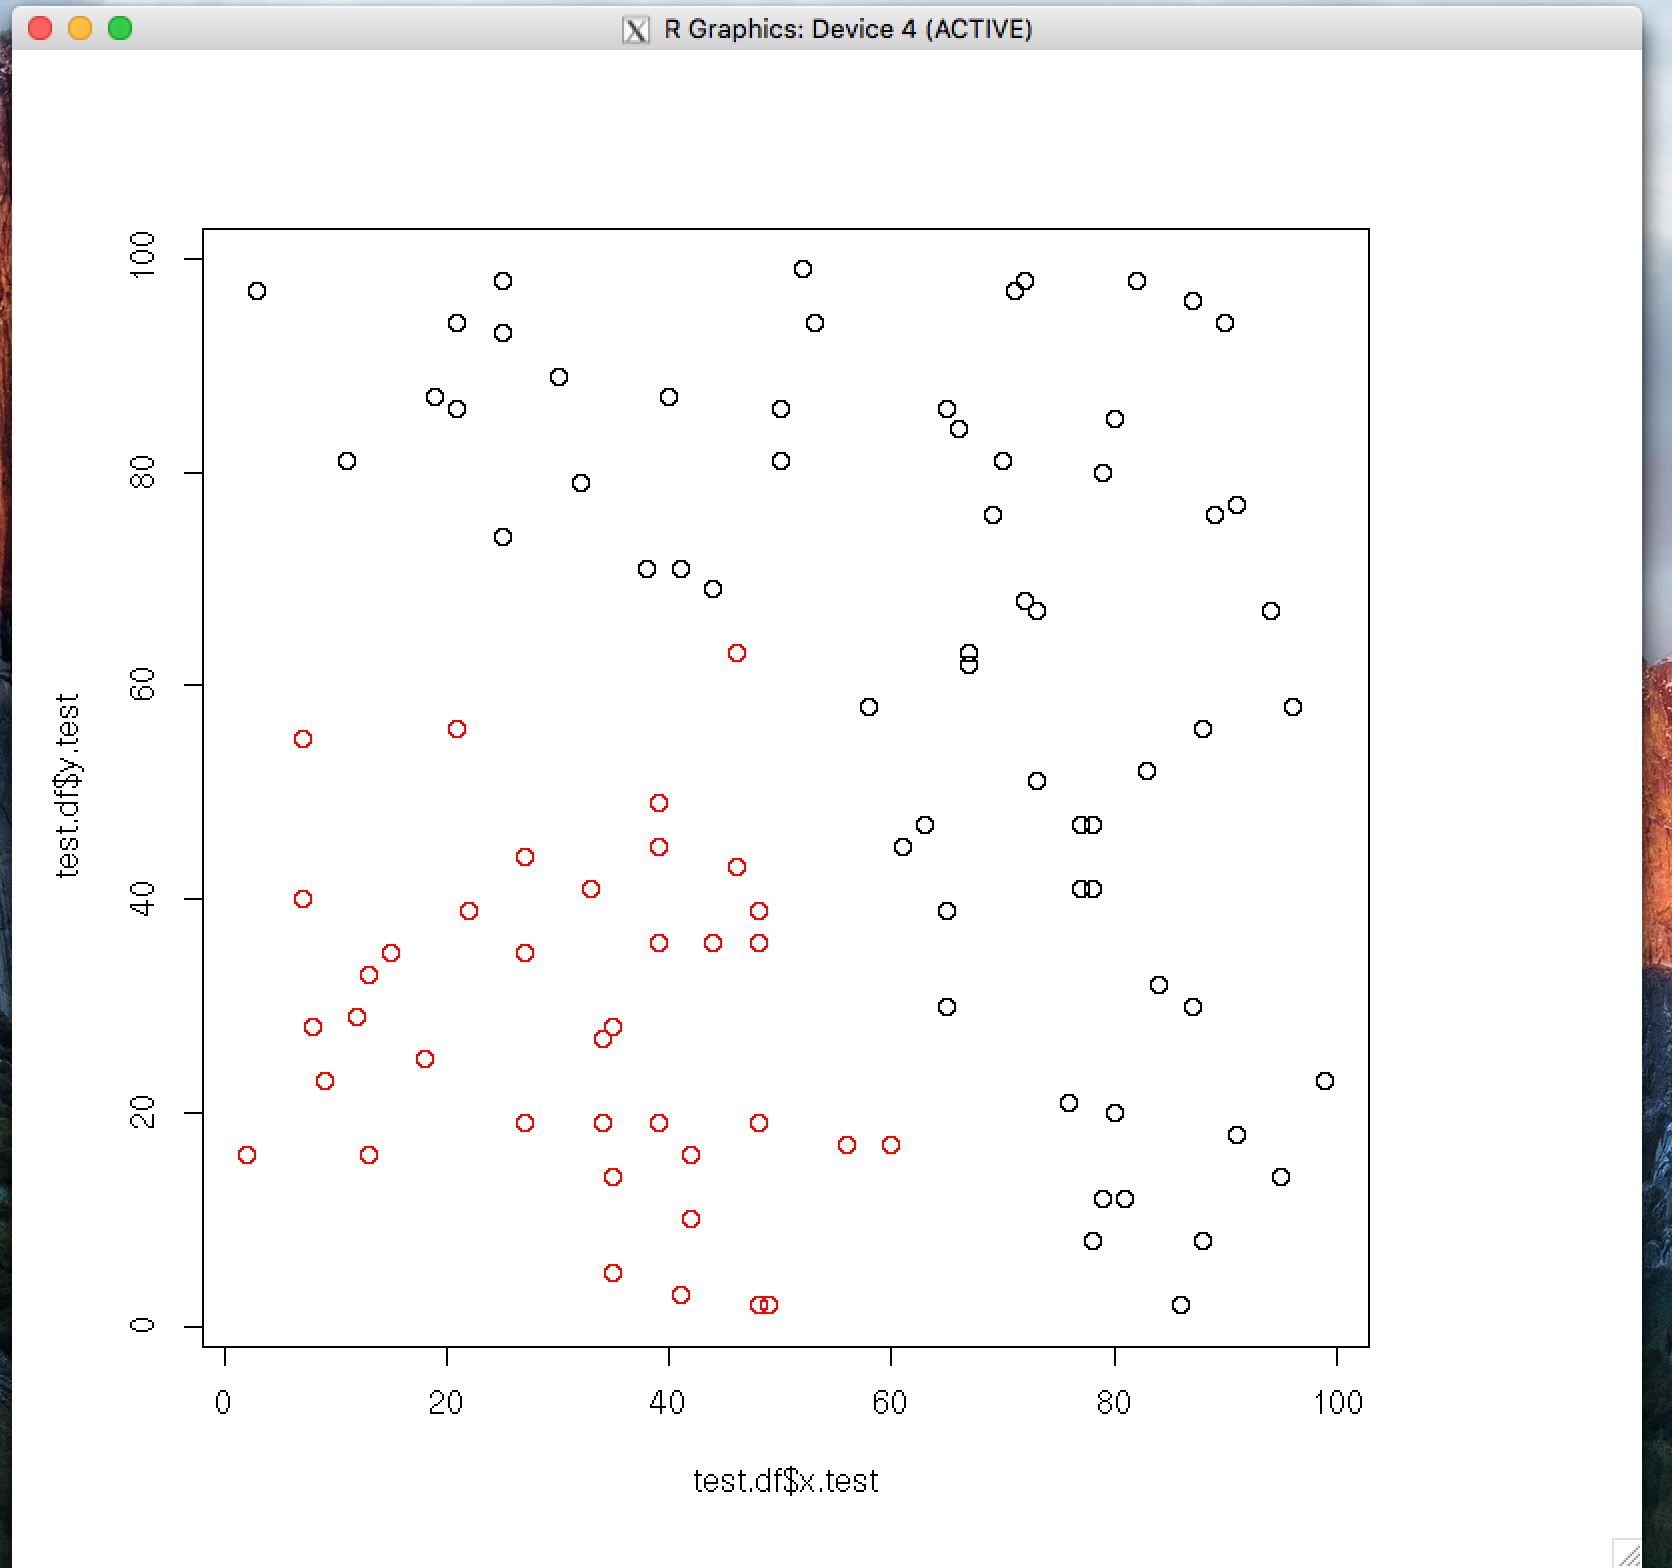
test.df <- data.frame(x.test, y.test)我认为主要的问题就在这里。我认为您想将从Bayes分类器获得的类标签传递给knn,即向量classes。相反,您传递的是cl,它只是test.df中案例的顺序标签--也就是说,它们没有意义。
#cl <- factor(c(rep("blue", 50), rep("orange", 50)))

k <- knn(train.df, test.df, classes, k=25)
plot(test.df$x.test, test.df$y.test, col=k)
页面原文内容由Stack Overflow提供。腾讯云小微IT领域专用引擎提供翻译支持
原文链接:
https://stackoverflow.com/questions/39820218
复制相关文章
相似问题
腾讯云开发者

Copyright © 2013 - 2026 Tencent Cloud. All Rights Reserved. 腾讯云 版权所有
深圳市腾讯计算机系统有限公司 ICP备案/许可证号:粤B2-20090059 ![]() 粤公网安备44030502008569号
粤公网安备44030502008569号
腾讯云计算(北京)有限责任公司 京ICP证150476号 | 京ICP备11018762号