
使用Python以相同的图形绘制两个.txt文件
使用Python以相同的图形绘制两个.txt文件
提问于 2016-09-28 06:11:57
我试图以相同的图形绘制两个.txt文件。为此,我使用了一个简单的Python脚本。
import sys
import os
import numpy
import matplotlib.pyplot as plt
from pylab import *
trap_error = 'trap_error.txt'
N , error = numpy.loadtxt(trap_error, unpack =True)
monte_error = 'monte_carlo_error.txt'
points, Integral, error = numpy.loadtxt(monte_error, unpack =True)
plt.loglog(N,error, 'o')
plt.loglog(points,error, 's')
plt.xlabel('Number of equally spaced points N')
plt.ylabel('error')
plt.legend(['trapezoid rule error', 'monte carlo error'], loc = 'upper right')
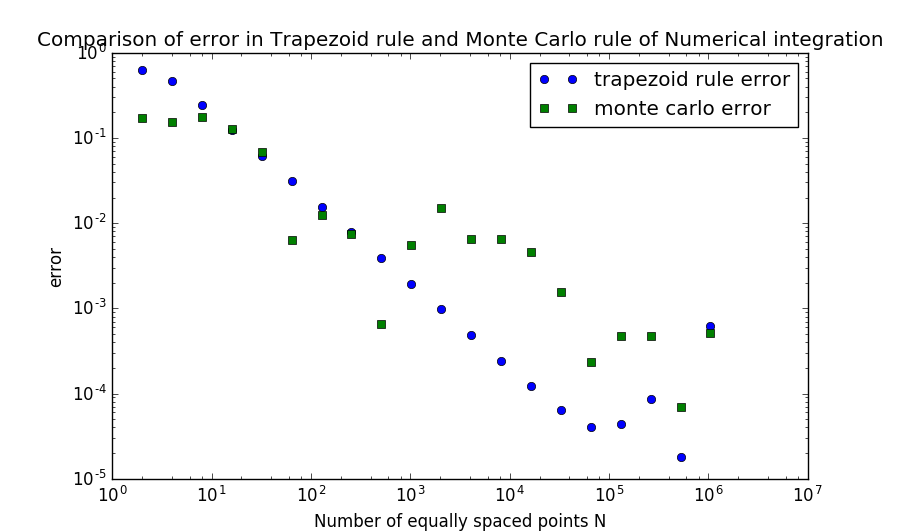
plt.title('Comparison of error in Trapezoid rule and Monte Carlo rule of Numerical integration')
plt.show()输出图只显示monte数据,而不显示梯形数据。这两个数据文件的大小顺序几乎是一样的,所以我不明白为什么不能在相同的数字中看到其他数据。为了方便起见,我也分享了这些数据文件。
  #points    Integral    error      # monte_carlo_error.txt
   2          1.400697    0.170100
   4          1.415539    0.155258
   8          1.394789    0.176008
   16         1.444948    0.125848
   32         1.501825    0.068971
   64         1.577106    0.006309
   128        1.558217    0.012580
   256        1.563389    0.007407
   512        1.570139    0.000657
   1024       1.576300    0.005504
   2048       1.585733    0.014937
   4096       1.577355    0.006558
   8192       1.577293    0.006497
   16384      1.575404    0.004607
   32768      1.572333    0.001536
   65536      1.571028    0.000232
   131072     1.570317    0.000479
   262144     1.570318    0.000478
   524288     1.570867    0.000070
   1048576    1.571311    0.000515

#N           error         #trap_error.txt
2            0.629204
4            0.472341
8            0.243747
16           0.123551
32           0.062155
64           0.031166
128          0.015604
256          0.007807
512          0.003905
1024         0.001953
2048         0.000977
4096         0.000487
8192         0.000244
16384        0.000124
32768        0.000064
65536        0.000040
131072       0.000044
262144       0.000087
524288       0.000018
1048576 0.000615回答 3
Stack Overflow用户
回答已采纳
发布于 2016-09-28 06:38:03
尝试以下几点:
import sys
import os
import numpy
import matplotlib.pyplot as plt
from pylab import *

trap_error = 'trap_error.txt'
N, error1 = numpy.loadtxt(trap_error, unpack=True)

monte_error = 'monte_carlo_error.txt'
points, Integral, error2 = numpy.loadtxt(monte_error, unpack=True)

plt.loglog(N, error1, 'o')
plt.loglog(points, error2, 's')

plt.xlabel('Number of equally spaced points N')
plt.ylabel('error')
plt.legend(['trapezoid rule error', 'monte carlo error'], loc = 'upper right')
plt.title('Comparison of error in Trapezoid rule and Monte Carlo rule of Numerical integration')
plt.show()
给予:
对于这两组数据,您都重用了error变量。
Stack Overflow用户
发布于 2016-09-28 06:40:46
您将覆盖变量error,并绘制相同的内容两次:
N , error = numpy.loadtxt(trap_error, unpack =True)然后
points, Integral, error = numpy.loadtxt(monte_error, unpack =True)对变量使用不同的名称,您应该会很好。例子:
N , error_trap = numpy.loadtxt(trap_error, unpack =True)和
points, Integral, error_monte = numpy.loadtxt(monte_error, unpack =True)还将绘图命令更改为:
plt.loglog(N,error_trap, 'o')

plt.loglog(points,error_monte, 's')Stack Overflow用户
发布于 2016-09-28 07:07:17
您重写了trap_error.txt文件中的错误。使用下面的代码解决问题
trap_error = 'trap_error.txt'
N , error1 = numpy.loadtxt(trap_error, unpack =True)
monte_error = 'monte_carlo_error.txt'
points, Integral, error2 = numpy.loadtxt(monte_error, unpack =True)
plt.loglog(N,error1, 'o')
plt.loglog(points,error2, 's')页面原文内容由Stack Overflow提供。腾讯云小微IT领域专用引擎提供翻译支持
原文链接:
https://stackoverflow.com/questions/39739291
复制相关文章
相似问题
腾讯云开发者

Copyright © 2013 - 2026 Tencent Cloud. All Rights Reserved. 腾讯云 版权所有
深圳市腾讯计算机系统有限公司 ICP备案/许可证号:粤B2-20090059 ![]() 粤公网安备44030502008569号
粤公网安备44030502008569号
腾讯云计算(北京)有限责任公司 京ICP证150476号 | 京ICP备11018762号