
R中质谱图的绘制
R中质谱图的绘制
提问于 2016-09-26 02:01:36
我想在R中绘制不同样品的质谱的三维叠加图,很像下面的图:(https://www.researchgate.net/publication/7662272/figure/fig1/AS:280563387781122@1443902932685/Figure-4-3D-overlay-zoom-plot-of-mass-spectra-of-a-serum-sample-from-one-person.png)
我一直在尝试使用像'plot3D‘这样的包,但是最后的情节看上去不那么出众。是否有其他软件包可以产生与链接中的包相似/相同的图形?
回答 1
Stack Overflow用户
回答已采纳
发布于 2016-09-26 04:33:48
我建议rgl套餐。
榜样;
library(rgl)

# example data
df <- cbind(expand.grid(x = 1:20, y = c(1,2,4,5)),
            z = c(dnorm(1:20, 18), dnorm(1:20, 14), dnorm(1:20, 6), dnorm(1:20, 2)))

open3d()
plot3d(df, type="n", axes=F, ylab="", ylim=c(0.5, 5.5), zlim = c(0, 1))  # a draft
axes3d(edge="bbox", xat=-10, yat=-10, zat=-10)  # make a piece of box
axes3d(c("x", "z"))                                       # x and z axis
axis3d("y+-", at = c(1,2,4,5), label = c("t = 5", "t = 4", "t = 15", "t = 20"))  # y axis
for(i in c(1,2,4,5)) lines3d(df[df$y == i,], col=i+1)
text3d(5, 3, 0, "test", font=2)
另一个例子;
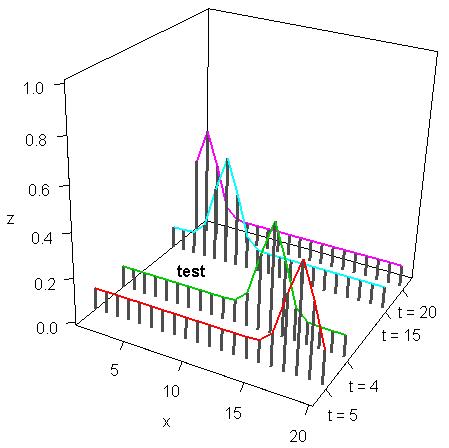
library(rgl); library(dplyr)

# example data
df <- cbind(expand.grid(x = 1:20, y = c(1,2,4,5)),
            z = c(dnorm(1:20, 18), dnorm(1:20, 14), dnorm(1:20, 6), dnorm(1:20, 2)))
df2 <- df %>% mutate(z = jitter(z) + 0.1)

open3d()       # type = "h" draw segments from z = 0. If you want another value for `from`, `segments3d()` achieves it.
plot3d(df2, type="h", axes=F, ylab="", ylim=c(0.5, 5.5), col="gray30", zlim=c(0, 1), lwd=3)
axes3d(edge="bbox", xat=-10, yat=-10, zat=-10)            # make a piece of box
axes3d(c("x", "z"))                                       # x and z axis
axis3d("y+-", at = c(1,2,4,5), label = c("t = 5", "t = 4", "t = 15", "t = 20"))  # y axis
for(i in c(1,2,4,5)) lines3d(df2[df2$y == i,], col=i+1, lwd=2)
text3d(5, 3, 0.05, "test", font=2)
页面原文内容由Stack Overflow提供。腾讯云小微IT领域专用引擎提供翻译支持
原文链接:
https://stackoverflow.com/questions/39693721
复制相关文章
相似问题
腾讯云开发者

Copyright © 2013 - 2026 Tencent Cloud. All Rights Reserved. 腾讯云 版权所有
深圳市腾讯计算机系统有限公司 ICP备案/许可证号:粤B2-20090059 ![]() 粤公网安备44030502008569号
粤公网安备44030502008569号
腾讯云计算(北京)有限责任公司 京ICP证150476号 | 京ICP备11018762号