
R在sankeyNetwork中指定颜色
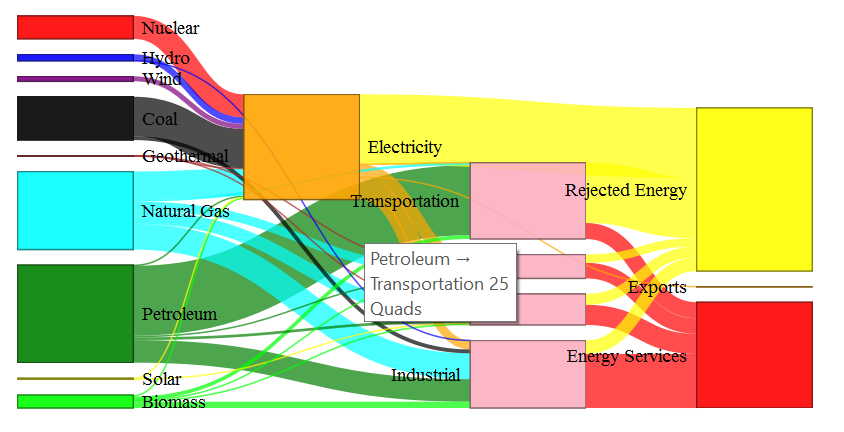
我试图使用R中的networkD3包创建一个Sankey图,特别是sankeyNetwork函数。我试图复制劳伦斯·利弗莫尔国家实验室的桑基图:

到目前为止,我已经能够使用以下代码来接近:
数据:
energy <- structure(list(nodes = structure(list(name = structure(c(15L,
 11L, 8L, 17L, 7L, 10L, 2L, 1L, 12L, 4L, 14L, 3L, 9L, 16L, 13L,
 6L, 5L), .Label = c("Biomass", "Coal", "Commericial", "Electricity",
"Energy Services", "Exports", "Geothermal", "Hydro", "Industrial",
"Natural Gas", "Nuclear", "Petroleum", "Rejected Energy", "Residential",
"Solar", "Transportation", "Wind"), class = "factor")), .Names = "name",                   class = "data.frame", row.names = c(NA,
-17L)), links = structure(list(source = c(0L, 0L, 1L, 2L, 2L,
 3L, 4L, 4L, 4L, 5L, 5L, 5L, 5L, 5L, 6L, 6L, 7L, 7L, 7L, 7L, 7L,
 8L, 8L, 8L, 8L, 8L, 9L, 9L, 9L, 9L, 9L, 9L, 10L, 10L, 11L, 11L,
 12L, 12L, 13L, 13L), target = c(9L, 10L, 9L, 9L, 12L, 9L, 9L,
 10L, 11L, 9L, 10L, 11L, 12L, 13L, 9L, 12L, 9L, 10L, 11L, 12L,
 13L, 9L, 10L, 11L, 12L, 13L, 10L, 11L, 12L, 13L, 14L, 15L, 14L,
 16L, 14L, 16L, 14L, 16L, 14L, 16L), value = c(0.25, 0.28, 8.34,
 2.38, 0.01, 1.81, 0.16, 0.04, 0.02, 9.99, 4.75, 3.3, 9.36, 0.92,
 14.3, 1.41, 0.52, 0.45, 0.13, 2.28, 1.35, 0.28, 0.98, 0.56, 8.2,
 25.4, 4.78, 4.63, 3.27, 0.03, 25.4, 0.08, 3.95, 7.33, 3.05, 5.66,
 4.91, 19.6, 21.9, 5.81), energy_type = structure(c(12L, 12L,
 9L, 7L, 7L, 13L, 6L, 6L, 6L, 8L, 8L, 8L, 8L, 8L, 2L, 2L, 1L,
 1L, 1L, 1L, 1L, 10L, 10L, 10L, 10L, 10L, 3L, 3L, 3L, 3L, 11L,
 5L, 11L, 4L, 11L, 4L, 11L, 4L, 11L, 4L), .Label = c("Biomass",
"Coal", "Electricity", "Energy Services", "Exports", "Geothermal",
"Hydro", "Natural", "Nuclear", "Petroleum", "Rejected Energy",
"Solar", "Wind"), class = "factor")), .Names = c("source", "target",
"value", "energy_type"), class = "data.frame", row.names = c(NA,
-40L))), .Names = c("nodes", "links"))
实际代码是:
library(networkD3)

sankeyNetwork(Links = energy$links, Nodes = energy$nodes, Source = "source",
              Target = "target", Value = "value", NodeID = "name",
              units = "Quads", LinkGroup = "energy_type", colourScale = JS(
                'd3.scale.ordinal()
                   .domain(["Solar","Nuclear","Hydro","Wind","Geothermal","Natural Gas","Coal","Biomass","Petroleum","Electricity","Residential","Commericial","Industrial","Transportation","Rejected Energy","Exports","Energy Services"])
                   .range(["#FFFF00","#FF0000","#0000FF","#800080","#A52A2A","#00FFFF","#000000","#00FF00","#008000","#FFA500","#FAAFBE","#FAAFBE","#FAAFBE","#FAAFBE","#C0C0C0","#FFA500","#808080"])'
), fontSize = 12, nodeWidth = 75, iterations = 100)我的问题是,我不能使颜色匹配正确。我想指定我自己的颜色。我是D3的新手,所以这可能是我的问题。我认为我的问题在代码的d3.scale.ordinal()部分,所以我已经解决了它,希望能够更容易地找到我的错误。但我想我是想告诉功能,把“天然气”框涂成青色(#00FFFF),但它显示出黄色。此外,“拒绝能源”和“能源服务”的颜色也是关闭的。
回答 3
Stack Overflow用户
发布于 2016-09-23 11:27:54
也许这个有帮助。我将尝试在网上发表评论。正如chinsoon12所建议的,似乎您的节点并不完全匹配。运行他的代码,我们看到了。
> setdiff(energy$links$energy_type, energy$nodes$name)
[1] "Natural"这告诉我们,"Natural"在您的数据中用于链接,而"Natural Gas"则用于您的节点。我经常发现使用data.frame来帮助我识别颜色标度中的问题是很有帮助的。
energy <- structure(list(nodes = structure(list(name = structure(c(15L,
     11L, 8L, 17L, 7L, 10L, 2L, 1L, 12L, 4L, 14L, 3L, 9L, 16L, 13L,
     6L, 5L), .Label = c("Biomass", "Coal", "Commericial", "Electricity",
    "Energy Services", "Exports", "Geothermal", "Hydro", "Industrial",
    "Natural Gas", "Nuclear", "Petroleum", "Rejected Energy", "Residential",
    "Solar", "Transportation", "Wind"), class = "factor")), .Names = "name",                   class = "data.frame", row.names = c(NA,
    -17L)), links = structure(list(source = c(0L, 0L, 1L, 2L, 2L,
     3L, 4L, 4L, 4L, 5L, 5L, 5L, 5L, 5L, 6L, 6L, 7L, 7L, 7L, 7L, 7L,
     8L, 8L, 8L, 8L, 8L, 9L, 9L, 9L, 9L, 9L, 9L, 10L, 10L, 11L, 11L,
     12L, 12L, 13L, 13L), target = c(9L, 10L, 9L, 9L, 12L, 9L, 9L,
     10L, 11L, 9L, 10L, 11L, 12L, 13L, 9L, 12L, 9L, 10L, 11L, 12L,
     13L, 9L, 10L, 11L, 12L, 13L, 10L, 11L, 12L, 13L, 14L, 15L, 14L,
     16L, 14L, 16L, 14L, 16L, 14L, 16L), value = c(0.25, 0.28, 8.34,
     2.38, 0.01, 1.81, 0.16, 0.04, 0.02, 9.99, 4.75, 3.3, 9.36, 0.92,
     14.3, 1.41, 0.52, 0.45, 0.13, 2.28, 1.35, 0.28, 0.98, 0.56, 8.2,
     25.4, 4.78, 4.63, 3.27, 0.03, 25.4, 0.08, 3.95, 7.33, 3.05, 5.66,
     4.91, 19.6, 21.9, 5.81), energy_type = structure(c(12L, 12L,
     9L, 7L, 7L, 13L, 6L, 6L, 6L, 8L, 8L, 8L, 8L, 8L, 2L, 2L, 1L,
     1L, 1L, 1L, 1L, 10L, 10L, 10L, 10L, 10L, 3L, 3L, 3L, 3L, 11L,
     5L, 11L, 4L, 11L, 4L, 11L, 4L, 11L, 4L), .Label = c("Biomass",
    "Coal", "Electricity", "Energy Services", "Exports", "Geothermal",
    "Hydro", "Natural", "Nuclear", "Petroleum", "Rejected Energy",
    "Solar", "Wind"), class = "factor")), .Names = c("source", "target",
    "value", "energy_type"), class = "data.frame", row.names = c(NA,
    -40L))), .Names = c("nodes", "links"))

library(networkD3)

sankeyNetwork(Links = energy$links, Nodes = energy$nodes, Source = "source",
         Target = "target", Value = "value", NodeID = "name",
         units = "Quads", LinkGroup = 'energy_type', colourScale = JS(

           'd3.scaleOrdinal()
    .domain(["Solar","Nuclear","Hydro","Wind","Geothermal","Natural Gas","Coal","Biomass","Petroleum","Electricity","Residential","Commericial","Industrial","Transportation","Rejected Energy","Exports","Energy Services"])
    .range(["#FFFF00","#FF0000","#0000FF","#800080","#A52A2A","#00FFFF","#000000","#00FF00","#008000","#FFA500","#FAAFBE","#FAAFBE","#FAAFBE","#FAAFBE","#C0C0C0","#FFA500","#808080"])'

         ),
fontSize = 12, nodeWidth = 75, iterations = 100)

# putting in a data.frame might help see problems
color_scale <- data.frame(
  range = c("#FFFF00","#FF0000","#0000FF","#800080","#A52A2A","#00FFFF","#000000","#00FF00","#008000","#FFA500","#FAAFBE","#FAAFBE","#FAAFBE","#FAAFBE","#C0C0C0","#FFA500","#808080"),
  domain = c("Solar","Nuclear","Hydro","Wind","Geothermal","Natural Gas","Coal","Biomass","Petroleum","Electricity","Residential","Commericial","Industrial","Transportation","Rejected Energy","Exports","Energy Services"),
  nodes = energy$nodes,
  stringsAsFactors = FALSE
)

# once corrected color_scale can be used like this
sankeyNetwork(
  Links = energy$links, Nodes = energy$nodes, Source = "source",
  Target = "target", Value = "value", NodeID = "name",
  units = "Quads", LinkGroup = 'energy_type', colourScale = JS(
sprintf(
'd3.scaleOrdinal()
  .domain(%s)
  .range(%s)
',
jsonlite::toJSON(color_scale$domain),
jsonlite::toJSON(color_scale$range)
   )
  ),
  fontSize = 12, nodeWidth = 75, iterations = 100
)

# if we change Natural Gas to Natural then
#   the cyan appears as desired
color_scale[6,2] <- "Natural"
Stack Overflow用户
发布于 2018-03-01 21:15:29
我在节点名称中的空格也有问题。这里有一个例子
library(networkD3)
Class<-c("Fristående","Nästan_öppet", "Halvöppet", "Slutet")
# Class<-c("Fristående","Nästan öppet", "Halvöppet", "Slutet") #Broken
nClass<-length(Class)
UtMat<-matrix(c(6, 9, 8, 0,
            0, 9, 18, 3,
            0, 1, 18, 6,
            0, 0, 3, 10), nClass,nClass, byrow = TRUE, dimnames = list(Class, Class) )

ClassF <- structure(list(nodes = data.frame(name=as.factor(c(Class,Class)), label=c(Class,Class)),
                     links = data.frame(source = rep(c(0:3), each=4), # from
                                        target = rep(c(4:7), 4), # to
                                        value = as.vector(t(UtMat)),
                                        group = as.factor(rep(Class, each=4)))
                      )
                )
sankeyNetwork(Links = ClassF$links, Nodes = ClassF$nodes,
          Source = "source", Target = "target", Value = "value", NodeID = "name",
          units = "", LinkGroup = 'group',
          colourScale = JS(
            'd3.scaleOrdinal()
            .domain(["Fristående","Nästan_öppet","Halvöppet","Slutet"])
            .range(["#EDF8E9","#BAE4B3","#74C476","#238B45"])'
          ),
          fontFamily = "Arial", fontSize = 12, nodeWidth = 75)
在这个例子中,类应该从浅绿色到深绿色,但是如果我使用第二类向量(带空间),它就会把它搞砸。
Stack Overflow用户
发布于 2020-02-24 11:05:03
当要手动分配颜色时,可以避免与节点名称中的空格相关的问题,方法是不在.domain中指定d3.scaleOrdinal()。您只需以与节点相同的顺序在.range中介绍您的颜色。
例如,假设这是节点的顺序:Frist、Nästan_öppet、Halv ppet、Slutet,您只需指定以下内容:
'd3.scaleOrdinal()
.range(["#EDF8E9","#BAE4B3","#74C476","#238B45"])'https://stackoverflow.com/questions/39647938
复制相似问题
腾讯云开发者

Copyright © 2013 - 2026 Tencent Cloud. All Rights Reserved. 腾讯云 版权所有
深圳市腾讯计算机系统有限公司 ICP备案/许可证号:粤B2-20090059  粤公网安备44030502008569号
腾讯云计算(北京)有限责任公司 京ICP证150476号 | 京ICP备11018762号