
R:如何显示每个散点图类别中的点数?
R:如何显示每个散点图类别中的点数?
提问于 2016-09-20 00:32:18
如果我有一个像这个散点图这样的Plot.ly图:
suppressPackageStartupMessages(library("plotly"))
plot_ly(data = iris, x = Sepal.Length, y = Petal.Length, mode = "markers",
        color = Species)
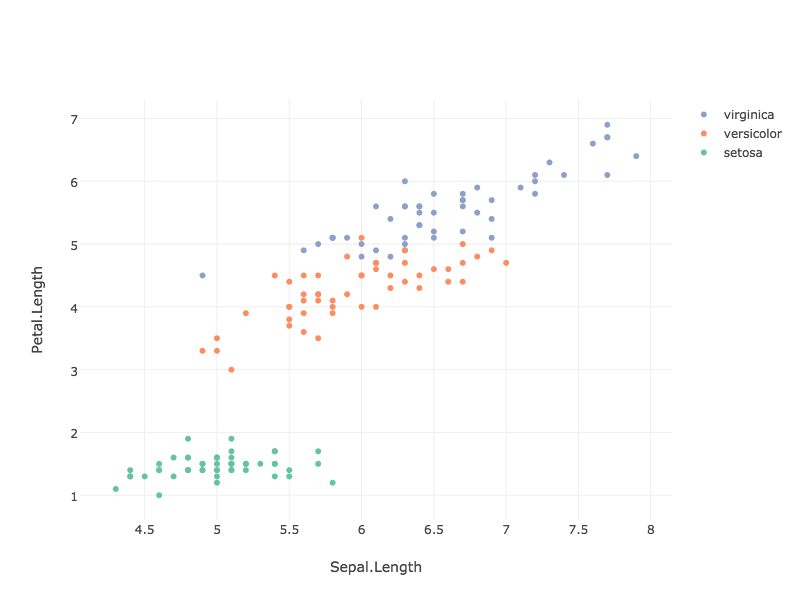
如何显示每个类别的点数?例如,我希望这个传说看起来像这样:
- 童贞- 35
- 云杉色- 44
- 赛多萨- 28
其中的数字是所显示的点数总数。是否有一种方法可以用Plot.ly来实现这一点,这样所显示的值将反映在图上显示的点数吗?是否还有其他使用Plot.ly实现此操作的方法?
回答 1
Stack Overflow用户
发布于 2016-09-20 07:42:05
n <- count(iris, Species) %>% mutate(new = paste(Species, '-', n))
levels(iris$Species) <- n$new

plotly::plot_ly(data = iris, x = Sepal.Length, y = Petal.Length, mode = "markers",
color = Species)页面原文内容由Stack Overflow提供。腾讯云小微IT领域专用引擎提供翻译支持
原文链接:
https://stackoverflow.com/questions/39584002
复制相关文章
相似问题
腾讯云开发者

Copyright © 2013 - 2026 Tencent Cloud. All Rights Reserved. 腾讯云 版权所有
深圳市腾讯计算机系统有限公司 ICP备案/许可证号:粤B2-20090059 ![]() 粤公网安备44030502008569号
粤公网安备44030502008569号
腾讯云计算(北京)有限责任公司 京ICP证150476号 | 京ICP备11018762号