
绘制chart指向chart.js图表
绘制chart指向chart.js图表
提问于 2016-09-12 12:49:01
我有一个API,返回一个jqplot图表的绘图点,我想知道是否有任何方法来更改它们,以便将它们插入到chart.js图表中?
API返回的点字符串类似于以下内容:
[[[1473396905000,1.925],[1473402008000,3.8978],[1473402311000,1.3657],[1473402605000,1.3194],[1473402905000,1.4289],[1473403206000,1.5782],[1473403505000,1.1818],[1473403807000,1.5151],[1473404105000,1.3052],[1473404406000,1.9036],[1473404706000,2.4173],[1473405006000,2.6117],[1473405305000,1.3249],[1473405605000,1.2773],[1473405905000,1.8293],[1473406206000,1.4242],[1473406505000,1.1342],[1473406806000,1.7527],[1473407106000,1.3627],[1473407406000,1.6494],[1473407705000,1.7232],[1473408006000,1.446],[1473408305000,1.5607],[1473408606000,1.5104],[1473408906000,1.4078],[1473409205000,1.5034],[1473409506000,1.8224],[1473409806000,2.2752],[1473410104000,1.0881],[1473410404000,1.509],[1473410705000,1.0817],[1473411005000,1.3751],[1473411305000,1.1361],[1473411606000,1.33],[1473411906000,1.5136],[1473412206000,1.6084],[1473412506000,1.0594],[1473412806000,1.544],[1473413106000,1.7347],[1473413406000,1.3446],[1473413705000,1.4276],[1473414006000,1.6119],[1473414306000,1.1018]]]任何帮助都是很棒的
回答 1
Stack Overflow用户
回答已采纳
发布于 2016-09-12 14:06:12
只要有一个小的解决办法,就有可能实现你想要的。
您需要使用Chart.js插件,它允许您处理所有图表创建过程中发生的事件(beforeInit、afterUpdate、afterDraw .)而且易于实施:
Chart.pluginService.register({
    beforeInit: function(chart) {
        // This will be triggered before the chart initalization
    }
});
现在只需要使用插件填充labels和data数组:
var fromAPI = [[[1473396905000,1.925],[1473402008000,3.8978],[1473402311000,1.3657]]];

Chart.pluginService.register({
    beforeInit: function(chart) {
        // We store the data -- Making it more readable
        var data = chart.config.data;

        // For each dataset in your array ..
        for (var i = 0; i < fromAPI.length; i++) {

            // For each data in your dataset ..
            for (var j = 0; j < fromAPI[i].length; j++) {

                // Populate the `labels` array with the first element
                data.labels[j] = fromAPI[i][j][0];

                // Populate the `data` array of this specific dataset with the 2nd element
                data.datasets[i].data[j] = fromAPI[i][j][1];
            }
        }
    }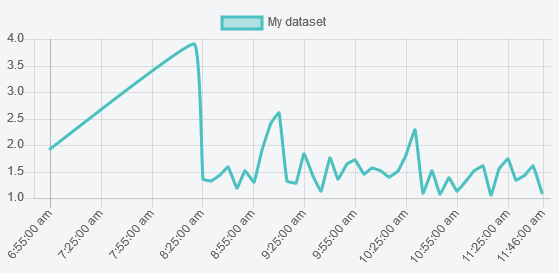
});您可以看到完整代码的在这个jsFiddle中,其结果如下:
页面原文内容由Stack Overflow提供。腾讯云小微IT领域专用引擎提供翻译支持
原文链接:
https://stackoverflow.com/questions/39450717
复制相关文章
相似问题
腾讯云开发者

Copyright © 2013 - 2026 Tencent Cloud. All Rights Reserved. 腾讯云 版权所有
深圳市腾讯计算机系统有限公司 ICP备案/许可证号:粤B2-20090059 ![]() 粤公网安备44030502008569号
粤公网安备44030502008569号
腾讯云计算(北京)有限责任公司 京ICP证150476号 | 京ICP备11018762号