
用mplot3D绘制DataFrame
用mplot3D绘制DataFrame
提问于 2016-09-08 15:45:20
我有这样的数据:
     f1        model  cost_threshold  sigmoid_slope
366  0.140625  open          0.0001         0.0001
445  0.356055  open          0.0001         0.0010
265  0.204674  open          0.0001         0.0100
562  0.230088  open          0.0001         0.0500
737  0.210923  open          0.0001         0.1500
117  0.161580  open          0.0001         0.1000
763  0.231648  open          0.0001         0.3000
466  0.186228  open          0.0001         0.5000
580  0.255686  open          0.0001         0.7500
520  0.163478  open          0.0001         1.0000
407  0.152488  open          0.0010         0.0001
717  0.183946  open          0.0010         0.0010
708  0.201499  open          0.0010         0.0100
570  0.179720  open          0.0010         0.0500
722  0.200326  open          0.0010         0.1500
316  0.187692  open          0.0010         0.1000
240  0.243612  open          0.0010         0.3000
592  0.274322  open          0.0010         0.5000
254  0.309560  open          0.0010         0.7500
400  0.225460  open          0.0010         1.0000
148  0.494311  open          0.0100         0.0001
100  0.498199  open          0.0100         0.0010
155  0.473008  open          0.0100         0.0100
494  0.484625  open          0.0100         0.0500
754  0.504391  open          0.0100         0.1500
636  0.425798  open          0.0100         0.1000
109  0.446701  open          0.0100         0.3000
759  0.509829  open          0.0100         0.5000
345  0.522837  open          0.0100         0.7500
702  0.511971  open          0.0100         1.0000
有更多的块,但正如你可以看到,每个cost_threshold包含10种类型的乙状结肠斜率。还有10个费用阈值。
我正试图根据表面图这里制作一个3D图。其演示是:
from mpl_toolkits.mplot3d import axes3d
import matplotlib.pyplot as plt
import numpy as np

fig = plt.figure()
ax = fig.add_subplot(111, projection='3d')
X, Y, Z = axes3d.get_test_data(0.05)
ax.plot_wireframe(X, Y, Z, rstride=10, cstride=10)

plt.show()
X,Y和Z必须是二维数组。
我如何创建X,Y和Z,我需要得到他们需要的格式?
垂直轴Z应为f1,cost_threshold和sigmoid_slope为X和Y。
此外,我如何添加一个单独的曲面图,其中的模型是no_model,然后覆盖这个曲面图到这里,在那里的f1列的值是不同的?
更新
我知道如何通过pivot表获得Z的2D数组:
Z = df.pivot_table('f1', 'cost_threshold', 'sigmoid_slope', fill_value=0).as_matrix()仍然不知道如何为X和Z创建一个。
回答 1
Stack Overflow用户
发布于 2016-09-08 16:42:53
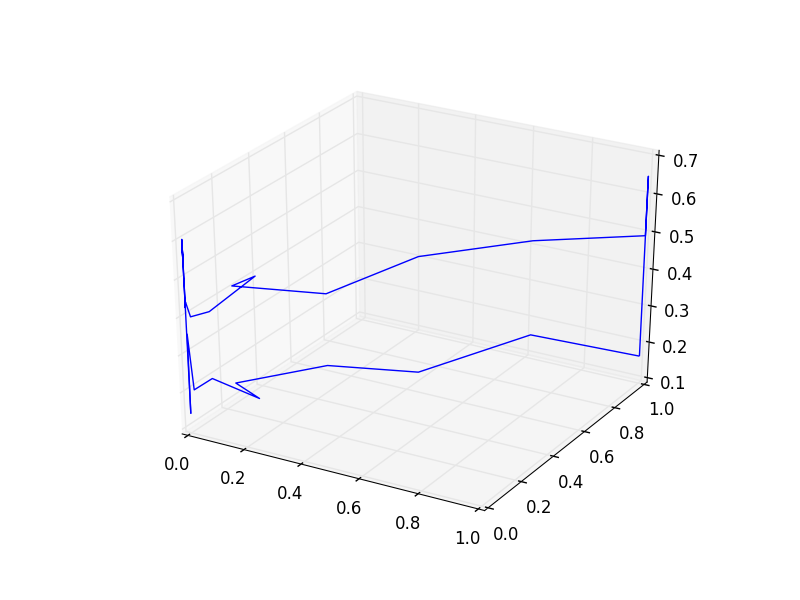
这是如何分别得到X,Y和Z:
Z = df.pivot_table('f1', 'cost_threshold', 'sigmoid_slope', fill_value=0).as_matrix()

Y = df.groupby("cost_threshold").sigmoid_slope.apply(pd.Series.reset_index, drop=True).unstack().values

Z = df.groupby("sigmoid_slope").cost_threshold.apply(pd.Series.reset_index, drop=True).unstack().values
如果你把这些传递到情节里,你就会得到:
页面原文内容由Stack Overflow提供。腾讯云小微IT领域专用引擎提供翻译支持
原文链接:
https://stackoverflow.com/questions/39395252
复制相关文章
相似问题
腾讯云开发者

Copyright © 2013 - 2026 Tencent Cloud. All Rights Reserved. 腾讯云 版权所有
深圳市腾讯计算机系统有限公司 ICP备案/许可证号:粤B2-20090059 ![]() 粤公网安备44030502008569号
粤公网安备44030502008569号
腾讯云计算(北京)有限责任公司 京ICP证150476号 | 京ICP备11018762号