
大熊猫与材料库图数据
大熊猫与材料库图数据
提问于 2016-09-06 04:13:02
我有下面的熊猫资料
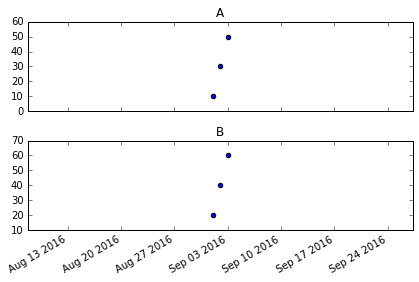
test = pd.DataFrame({'cities':['A','B','A','B','A','B',],
               'date':['2016-9-1','2016-9-1','2016-9-2','2016-9-2','2016-9-3','2016-9-3'],
               'count':[10,20,30,40,50,60]})
我想画两个散点图,一个是城市A,另一个是城市B。在每幅图中,x轴是日期,y轴是计数.
我试了一下,但是代码太难看了,我不敢把它贴上去。希望有人能用一些优雅的方法来帮助你。
谢谢。
回答 1
Stack Overflow用户
回答已采纳
发布于 2016-09-06 04:54:34
设置
test = pd.DataFrame({'cities':['A','B','A','B','A','B',],
               'date':['2016-9-1','2016-9-1','2016-9-2','2016-9-2','2016-9-3','2016-9-3'],
               'count':[10,20,30,40,50,60]})

test.date = pd.to_datetime(test.date)
溶液
import matplotlib.pyplot as plt


gb = test.groupby('cities')

fig, axes = plt.subplots(gb.ngroups)
for i, (name, df) in enumerate(gb):
    ax = axes[i]
    ax.scatter(df['date'].values, df['count'].values)
    ax.set_title(name)

fig.autofmt_xdate()
fig.tight_layout()
页面原文内容由Stack Overflow提供。腾讯云小微IT领域专用引擎提供翻译支持
原文链接:
https://stackoverflow.com/questions/39340537
复制相关文章
相似问题
腾讯云开发者

Copyright © 2013 - 2026 Tencent Cloud. All Rights Reserved. 腾讯云 版权所有
深圳市腾讯计算机系统有限公司 ICP备案/许可证号:粤B2-20090059 ![]() 粤公网安备44030502008569号
粤公网安备44030502008569号
腾讯云计算(北京)有限责任公司 京ICP证150476号 | 京ICP备11018762号