
MSChart HitResult AxisLabel
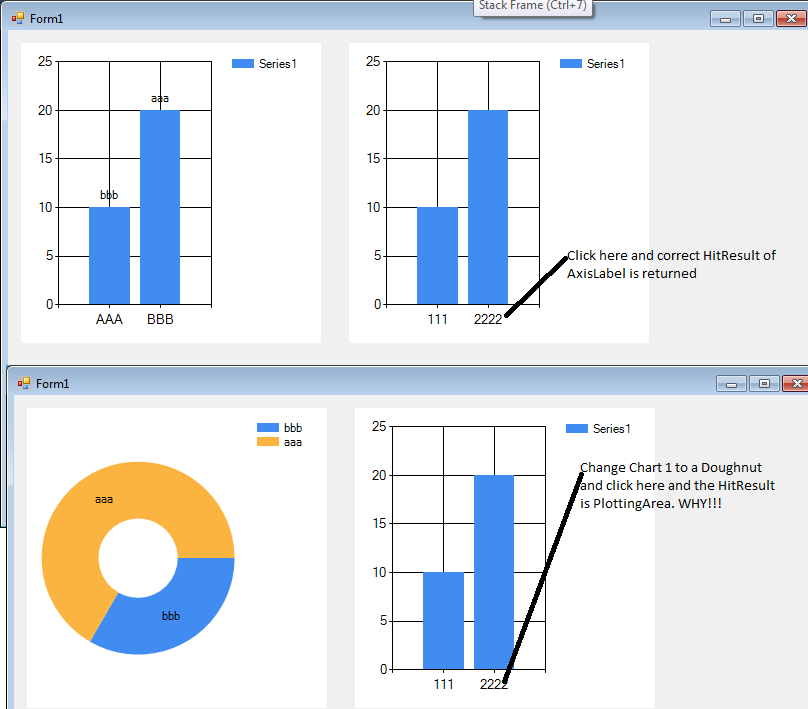
在C#中使用MS图表组件并尝试确定项目命中率(HitResult)。结果似乎并不总是准确的。如果我有两个图表。右边总是一个柱状图。左手边有时是柱状图,有时是甜甜圈。当左手边是甜甜圈时,从HitResult返回的项目是不正确的。我的意思是:
namespace WindowsFormsApplication5
{
    partial class Form1
    {
        /// <summary>
        /// Required designer variable.
        /// </summary>
        private System.ComponentModel.IContainer components = null;

        /// <summary>
        /// Clean up any resources being used.
        /// </summary>
        /// <param name="disposing">true if managed resources should be disposed; otherwise, false.</param>
        protected override void Dispose(bool disposing)
        {
            if (disposing && (components != null))
            {
                components.Dispose();
            }
            base.Dispose(disposing);
        }

        #region Windows Form Designer generated code

        /// <summary>
        /// Required method for Designer support - do not modify
        /// the contents of this method with the code editor.
        /// </summary>
        private void InitializeComponent()
        {
            System.Windows.Forms.DataVisualization.Charting.ChartArea chartArea1 = new System.Windows.Forms.DataVisualization.Charting.ChartArea();
            System.Windows.Forms.DataVisualization.Charting.Legend legend1 = new System.Windows.Forms.DataVisualization.Charting.Legend();
            System.Windows.Forms.DataVisualization.Charting.Series series1 = new System.Windows.Forms.DataVisualization.Charting.Series();
            System.Windows.Forms.DataVisualization.Charting.DataPoint dataPoint1 = new System.Windows.Forms.DataVisualization.Charting.DataPoint(0D, 10D);
            System.Windows.Forms.DataVisualization.Charting.DataPoint dataPoint2 = new System.Windows.Forms.DataVisualization.Charting.DataPoint(0D, 20D);
            System.Windows.Forms.DataVisualization.Charting.ChartArea chartArea2 = new System.Windows.Forms.DataVisualization.Charting.ChartArea();
            System.Windows.Forms.DataVisualization.Charting.Legend legend2 = new System.Windows.Forms.DataVisualization.Charting.Legend();
            System.Windows.Forms.DataVisualization.Charting.Series series2 = new System.Windows.Forms.DataVisualization.Charting.Series();
            System.Windows.Forms.DataVisualization.Charting.DataPoint dataPoint3 = new System.Windows.Forms.DataVisualization.Charting.DataPoint(0D, 10D);
            System.Windows.Forms.DataVisualization.Charting.DataPoint dataPoint4 = new System.Windows.Forms.DataVisualization.Charting.DataPoint(0D, 20D);
            this.chart1 = new System.Windows.Forms.DataVisualization.Charting.Chart();
            this.chart2 = new System.Windows.Forms.DataVisualization.Charting.Chart();
            ((System.ComponentModel.ISupportInitialize)(this.chart1)).BeginInit();
            ((System.ComponentModel.ISupportInitialize)(this.chart2)).BeginInit();
            this.SuspendLayout();
            //
            // chart1
            //
            chartArea1.Name = "ChartArea1";
            this.chart1.ChartAreas.Add(chartArea1);
            legend1.Name = "Legend1";
            this.chart1.Legends.Add(legend1);
            this.chart1.Location = new System.Drawing.Point(13, 13);
            this.chart1.Name = "chart1";
            series1.ChartArea = "ChartArea1";
            series1.ChartType = System.Windows.Forms.DataVisualization.Charting.SeriesChartType.Doughnut;
            series1.Label = "bbb";
            series1.Legend = "Legend1";
            series1.Name = "Series1";
            dataPoint1.AxisLabel = "AAA";
            dataPoint2.AxisLabel = "BBB";
            dataPoint2.Label = "aaa";
            series1.Points.Add(dataPoint1);
            series1.Points.Add(dataPoint2);
            this.chart1.Series.Add(series1);
            this.chart1.Size = new System.Drawing.Size(300, 300);
            this.chart1.TabIndex = 0;
            this.chart1.Text = "chart1";
            this.chart1.MouseDown += new System.Windows.Forms.MouseEventHandler(this.chart1_MouseDown);
            //
            // chart2
            //
            chartArea2.Name = "ChartArea1";
            this.chart2.ChartAreas.Add(chartArea2);
            legend2.Name = "Legend1";
            this.chart2.Legends.Add(legend2);
            this.chart2.Location = new System.Drawing.Point(341, 13);
            this.chart2.Name = "chart2";
            series2.ChartArea = "ChartArea1";
            series2.Legend = "Legend1";
            series2.Name = "Series1";
            dataPoint3.AxisLabel = "111";
            dataPoint4.AxisLabel = "2222";
            series2.Points.Add(dataPoint3);
            series2.Points.Add(dataPoint4);
            this.chart2.Series.Add(series2);
            this.chart2.Size = new System.Drawing.Size(300, 300);
            this.chart2.TabIndex = 1;
            this.chart2.Text = "chart2";
            this.chart2.MouseDown += new System.Windows.Forms.MouseEventHandler(this.chart1_MouseDown);
            //
            // Form1
            //
            this.AutoScaleDimensions = new System.Drawing.SizeF(6F, 13F);
            this.AutoScaleMode = System.Windows.Forms.AutoScaleMode.Font;
            this.ClientSize = new System.Drawing.Size(801, 490);
            this.Controls.Add(this.chart2);
            this.Controls.Add(this.chart1);
            this.Name = "Form1";
            this.Text = "Form1";
            ((System.ComponentModel.ISupportInitialize)(this.chart1)).EndInit();
            ((System.ComponentModel.ISupportInitialize)(this.chart2)).EndInit();
            this.ResumeLayout(false);

        }

        #endregion

        private System.Windows.Forms.DataVisualization.Charting.Chart chart1;
        private System.Windows.Forms.DataVisualization.Charting.Chart chart2;
    }
}回答 1
Stack Overflow用户
发布于 2016-09-05 12:13:53
查看设计器代码,很容易找到问题:--您将相同的事件连接到两个不同的 Chart控件。
这实际上是避免冗余代码的常见方法;诀窍是将sender转换为正确的控件类型,然后使用结果。
因此,您可能会使用错误的图表进行命中测试;您仍然没有显示MouseClick or MouseDown代码,但它很可能包含如下内容:
HitTestResult hitr = chart1.HitTest(e.X, e.Y);如果您真的只想使用一个事件,那么您需要的是:
HitTestResult hitr = ((Chart)sender).HitTest(e.X, e.Y);正如我在上面的评论中所解释的,首先不需要有两个Chart控件;添加一个额外的ChartArea并分配您想要在其中显示名称的系列:
ChartArea ca2 = chart1.ChartAreas.Add("ca2");
series1.ChartArea = "ca2";您可以动态地在ChartTypes之间切换,也许可以使用CheckBox
series1.ChartType = cbx_Pie.Checked ? SeriesChartType.Pie : SeriesChartType.Column;在一个中使用两个(或多个) ChartAreas有几个优点。他们不仅将拥有一个BorderStyle和Background,而且他们都将与DrawToBitmap一起使用相同的Bitmap,并且当调整“图表”的大小时,它们将缩放。但这是你的设计..。
https://stackoverflow.com/questions/39329543
复制相似问题
腾讯云开发者

Copyright © 2013 - 2026 Tencent Cloud. All Rights Reserved. 腾讯云 版权所有
深圳市腾讯计算机系统有限公司 ICP备案/许可证号:粤B2-20090059 ![]() 粤公网安备44030502008569号
粤公网安备44030502008569号
腾讯云计算(北京)有限责任公司 京ICP证150476号 | 京ICP备11018762号